
10-22-2025
Since 1977, Congress has defined the Federal Reserve’s objectives as “maximum employment, stable prices and moderate long-term interest rates.” Despite having three components, this has come to be known as the Fed’s “Dual Mandate.” Importantly, Congress did not specify how these objectives should be measured, leaving that up to the Fed.
On January 24, 2012, the Fed adopted its “Statement on Longer-Run Goals and Monetary Policy Strategy.” In an effort to enhance transparency and the effectiveness of monetary policy, the Fed defined how it interpreted its stable prices mandate from Congress: “The Committee judges that inflation at the rate of 2 percent, as measured by the annual change in the price index for personal consumption expenditures, is most consistent over the longer run with the Federal Reserve’s statutory mandate.”
More than a decade has passed since the Fed provided a way to grade its performance on inflation. However, to date, the Fed has not provided a report card on its performance. We can imagine how this report card should be compiled. In deciding whether the Fed has achieved its target for a year, it would be unreasonable to require inflation to be exactly 2 percent. Like the game of horseshoes, in monetary policy, close should count.
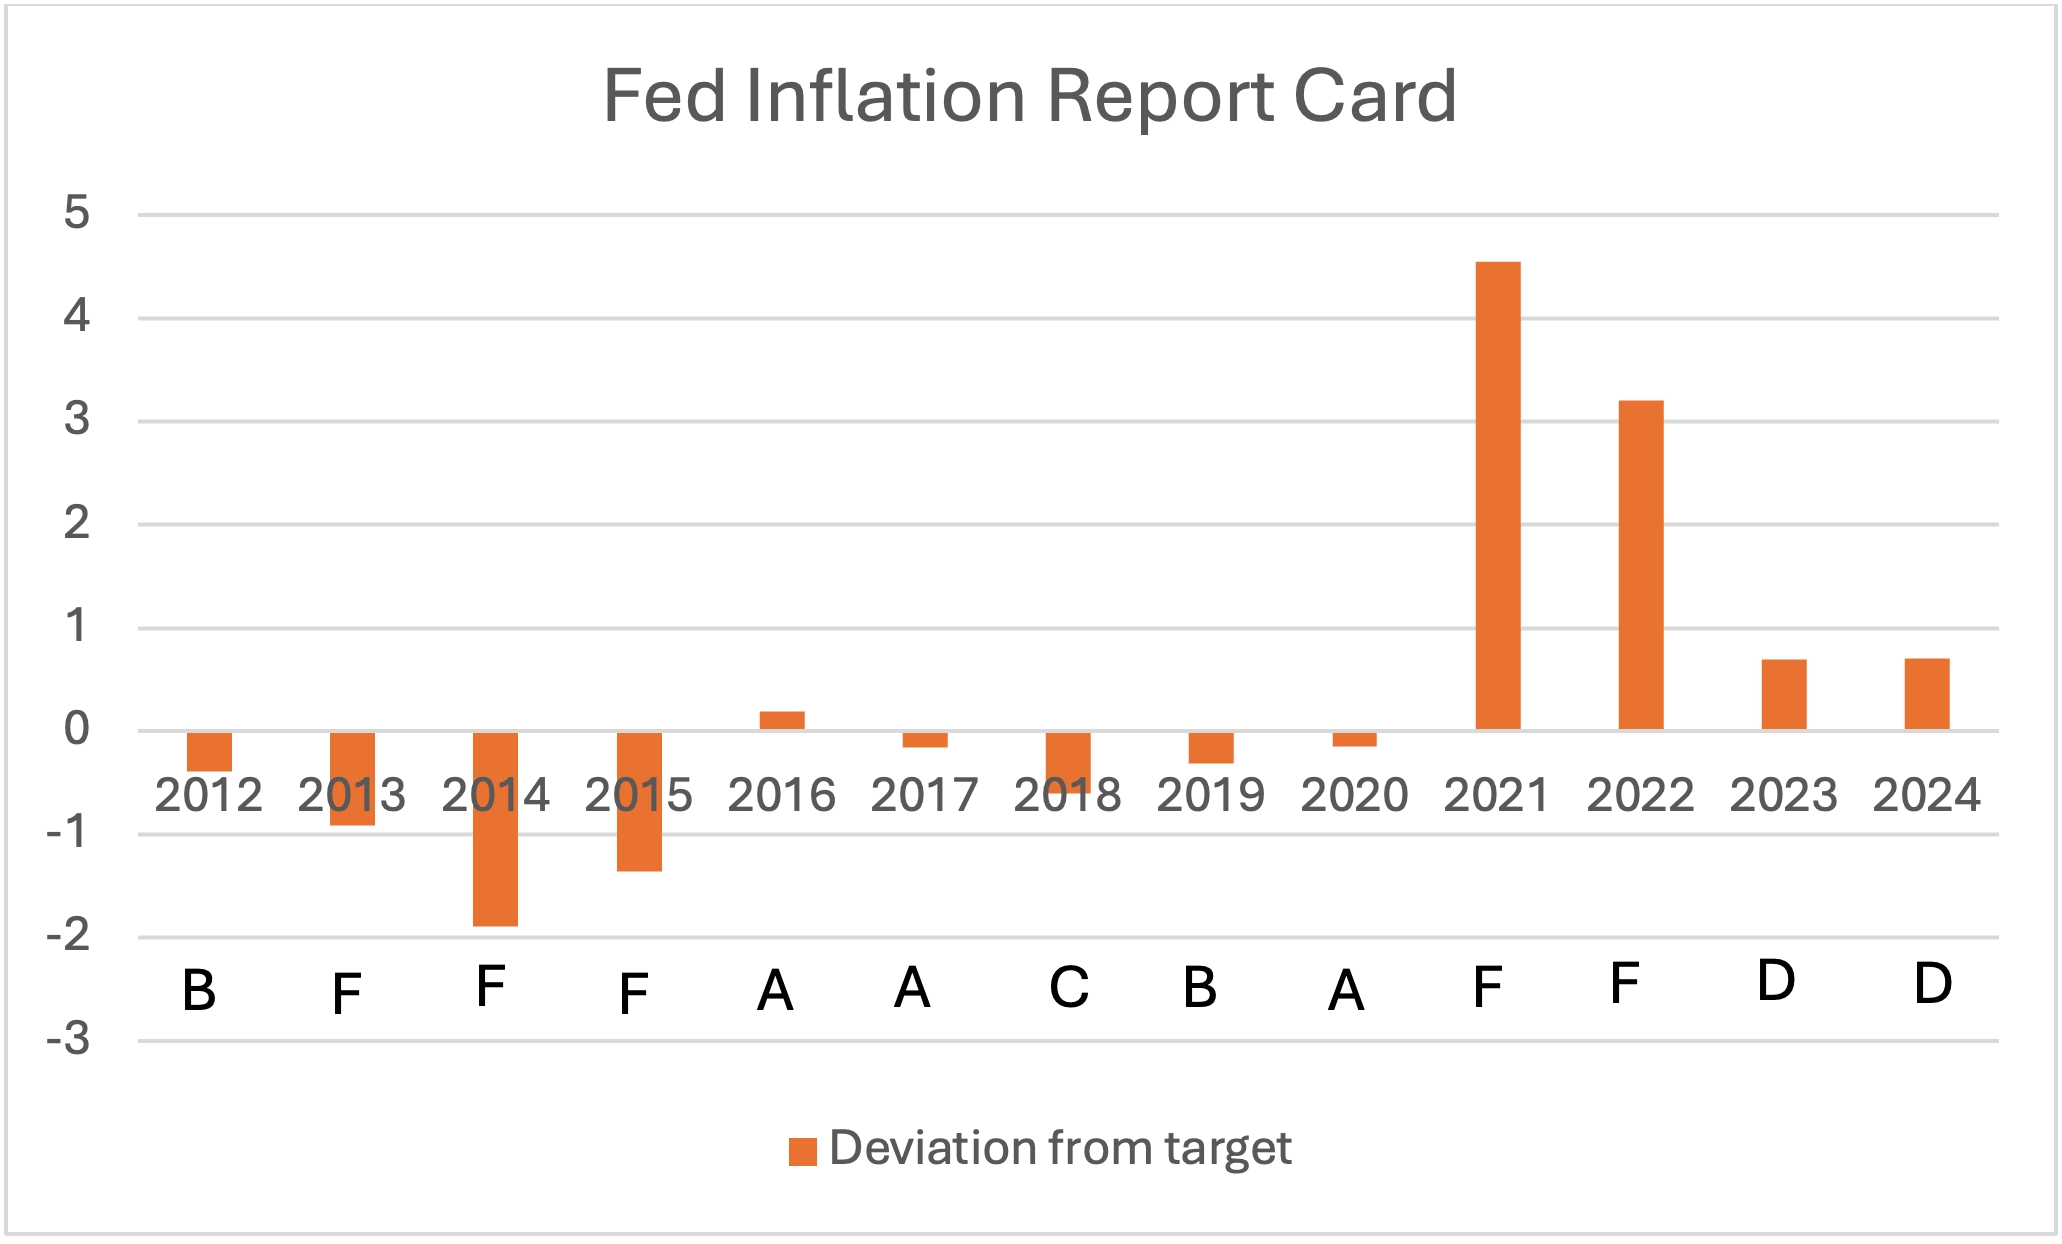
Let’s proceed with a grading curve where we mark the Fed as having achieved its target in a year if inflation is 2 percent plus or minus 10 percent of the Fed’s target. That is, the Fed gets an A if inflation that year is in the range from 1.8 to 2.2. To continue the grading curve, let’s assume each lower letter grade covers an additional 0.2 percent above and below the Fed’s target.
Since the 2012 framework was adopted at the end of January, we will grade the Fed on inflation in February of each subsequent year. The chart below is the Fed’s report card based on this approach. To date, the Fed has earned 3 As, 2 Bs, 1 C, 2 Ds and 5 Fs. Post-COVID, the Fed has consistently been failing. This report card is nothing to write home about.
The above grading system has each new year start with a clean slate, regardless of how badly the Fed might have missed the mark in the prior year. Another way to grade the Fed on inflation is to see, over time, how the Fed has been doing relative to a benchmark where the price index increases by 2 percent each year. In this case, prior misses are not forgiven as we move forward. This grading system is known as price-level targeting.
The chart below shows the actual path of the personal consumption expenditure (PCE) index (in blue) relative to a hypothetical PCE index that increases by a steady 2 percent from the adoption of the Fed’s 2012 policy framework in 2012 (in orange). Until the middle of 2022, the Fed’s cumulative inflation performance was consistently below the constant 2 percent benchmark.
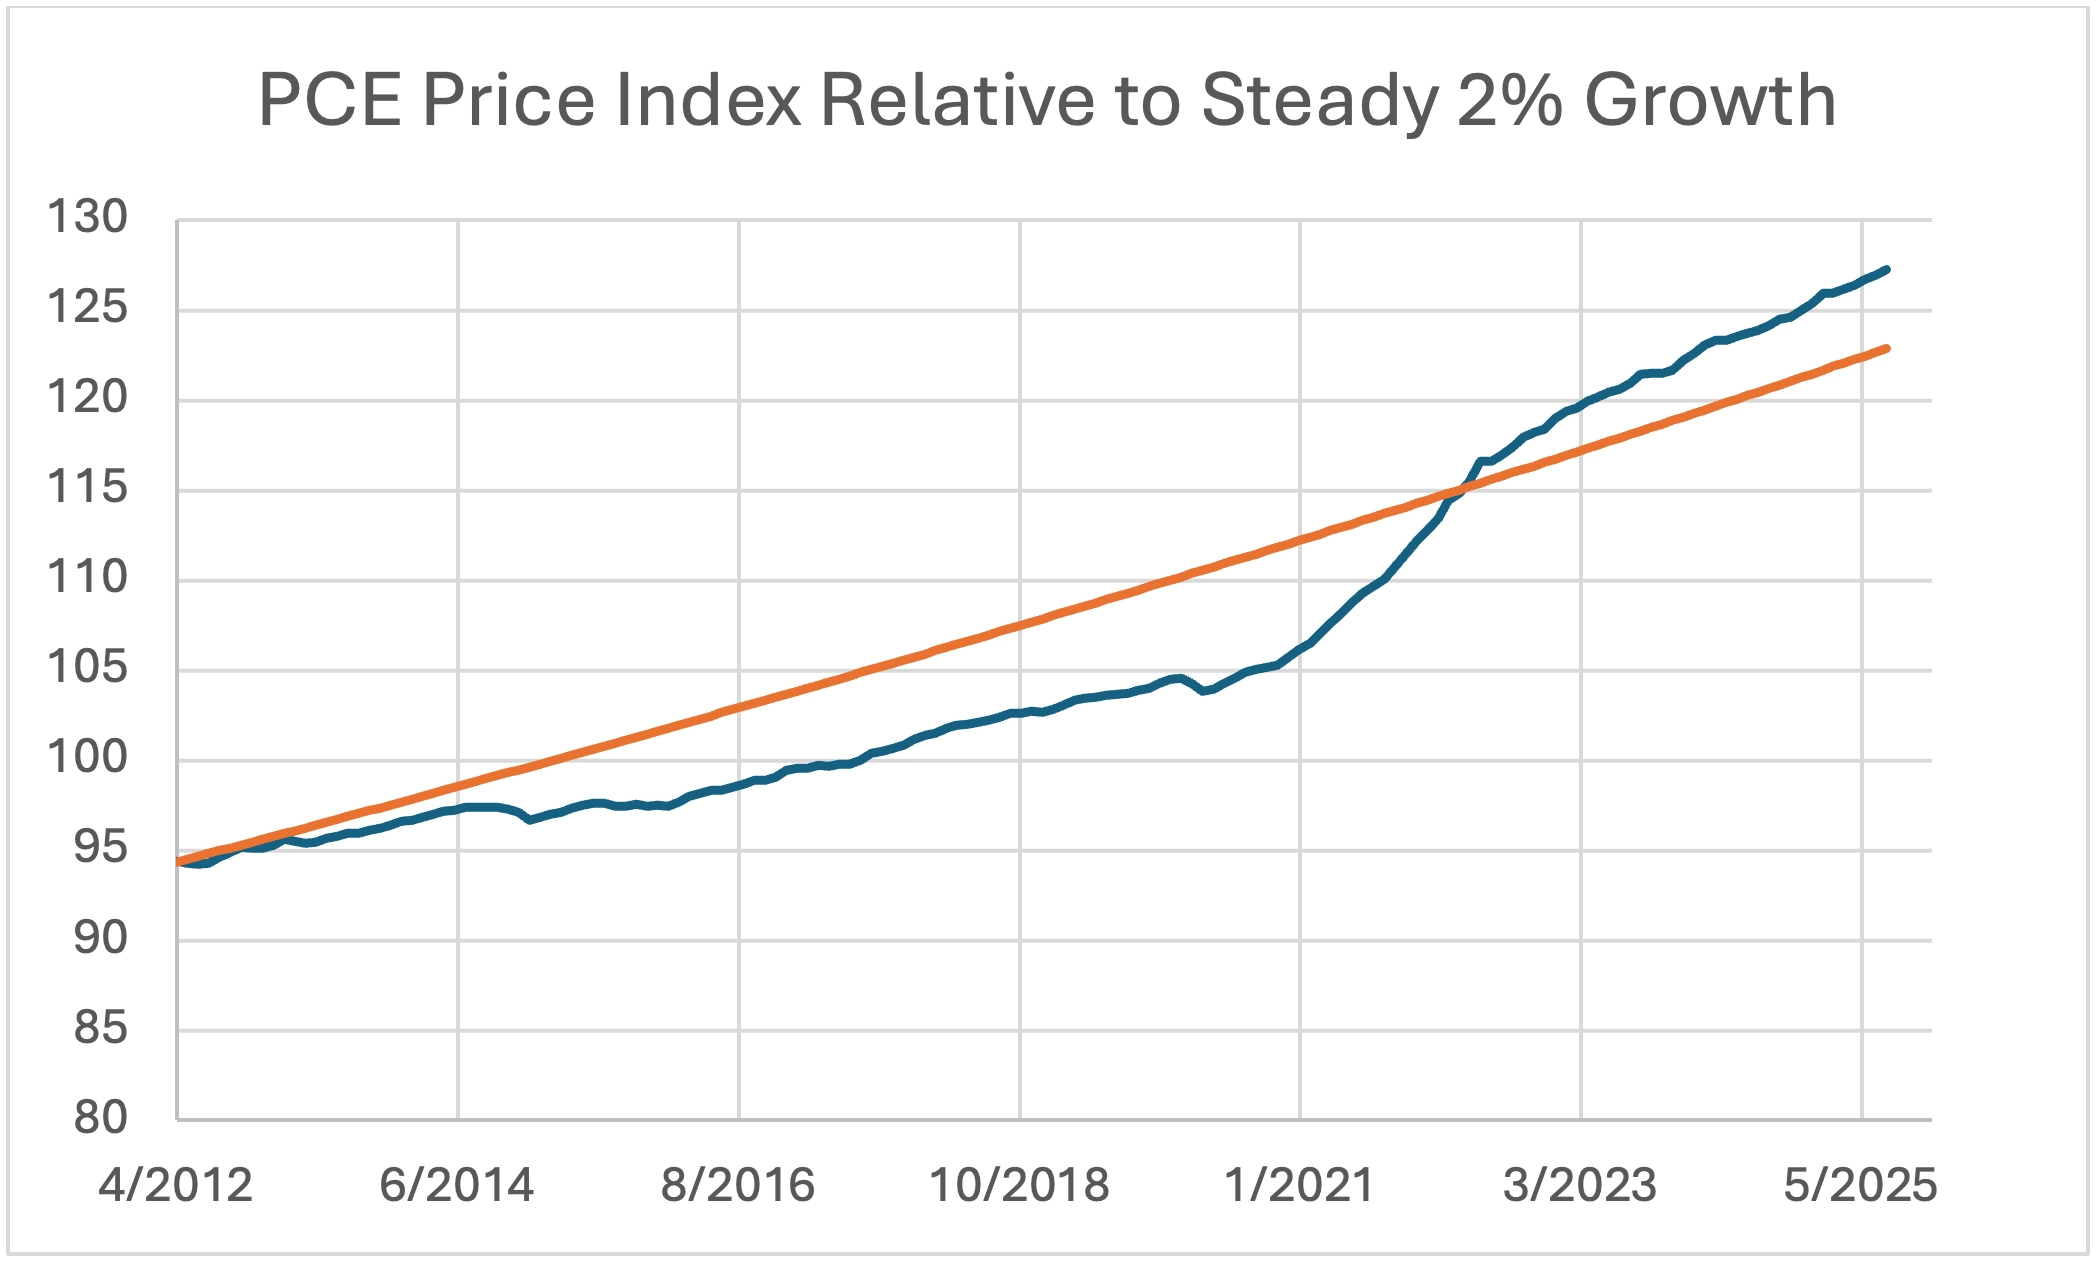
The negative gap reached its largest value in November of 2020 at roughly minus 6.6 percentage points. The gap subsequently closed in April of 2022. Since the Fed adopted a flexible average inflation targeting (FAIT) framework in August 2020, the closing of the gap between the second half of 2020 and the first half of 2022 might have been seen by the Fed as a positive development at the time. Interestingly, the Fed did not start raising its policy rate until March of 2022 (when the gap was almost closed). The gap has continued to grow, reaching a value of 4.4 percent as of August 2025.
On this inflation grading curve, misses above the benchmark are more concerning to the public than those below it. Households will still feel that groceries are “too expensive” even when the Fed gets inflation back down to 2 percent — reflecting the fact that the price level will still be well above the 2 percent per year benchmark.
Since 2012, when the Fed defined price stability as 2 percent PCE inflation, the Fed has only achieved annual inflation close to its target in three of 13 years. Comparing the Fed’s inflation performance based on a benchmark of a steady 2 percent per year rise in the PCE price index, the Fed has consistently been either below or above this benchmark.
This report card brings to mind Winston Churchill’s insight that “success is stumbling from failure to failure with no loss of enthusiasm.” Here’s to continued Fed enthusiasm.
Joseph Tracy is a Distinguished Fellow at Purdue University’s Daniels School of Business and a nonresident senior fellow at the American Enterprise Institute. Previously he was executive vice president and senior advisor to the president at the Federal Reserve Bank of Dallas. He regularly contributes insightful posts about financial markets to Daniels Insights.

