
03-04-2026
Financial bubbles, periods when asset prices accelerate rapidly before eventually reversing, tend to be difficult to recognize while they are occurring. From the dot-com boom and the U.S. housing bubble to more recent surges in enthusiasm tied to cryptocurrency markets and artificial intelligence, bubbles often appear obvious only in hindsight. Even after a bubble has burst, pinpointing exactly when it began and when it ultimately collapsed remains challenging, typically requiring complex statistical analysis that can still yield imprecise results.
Purdue Professor of Economics Mohitosh Kejriwal, along with coauthors Linh Nguyen and Pierre Perron, has developed a more reliable method to determine when bubble-like behavior begins and ends. Their findings are outlined in their research paper, “An Improved Procedure for Retrospectively Dating the Emergence and Collapse of Bubbles,” in the Journal of Time Series Analysis.
Even in hindsight, accurately dating financial bubbles is important because it helps policymakers better understand the economic and financial conditions surrounding these episodes. This allows them to design and implement more informed responses when comparable conditions arise.
“More accurate dating allows policymakers to distinguish causes from consequences. For example, whether changes in interest rates, regulation or credit conditions preceded the bubble or followed its collapse. This distinction is essential for drawing credible policy lessons,” says Kejriwal.
Historically, the statistical tools used to date asset bubbles have often fallen short. Existing methods could detect periods of explosive price behavior but tended to identify the beginning or end of a bubble with excessive delay, or produced results that varied depending on the assumptions built into the model. As a result, policymakers and researchers were left with an incomplete picture of how bubbles unfold, highlighting the need for a more reliable way to estimate when they emerge and collapse.
Rather than relying on traditional techniques that tend to recognize bubbles only after a considerable delay, Kejriwal and coauthors show why commonly used methods systematically misdate the onset and collapse of bubbles, and introduce a simple fix that corrects this bias
“What’s appealing about the method is that it doesn’t require complicated new machinery. Traditional methods let the moment a bubble collapses heavily influence the calculations, which ends up pushing the estimated dates too far forward in time. We show that by making a small adjustment, essentially preventing that single moment from distorting the estimates, we can get a much clearer and more accurate picture of when the boom really began and when it ended,” says Kejriwal.
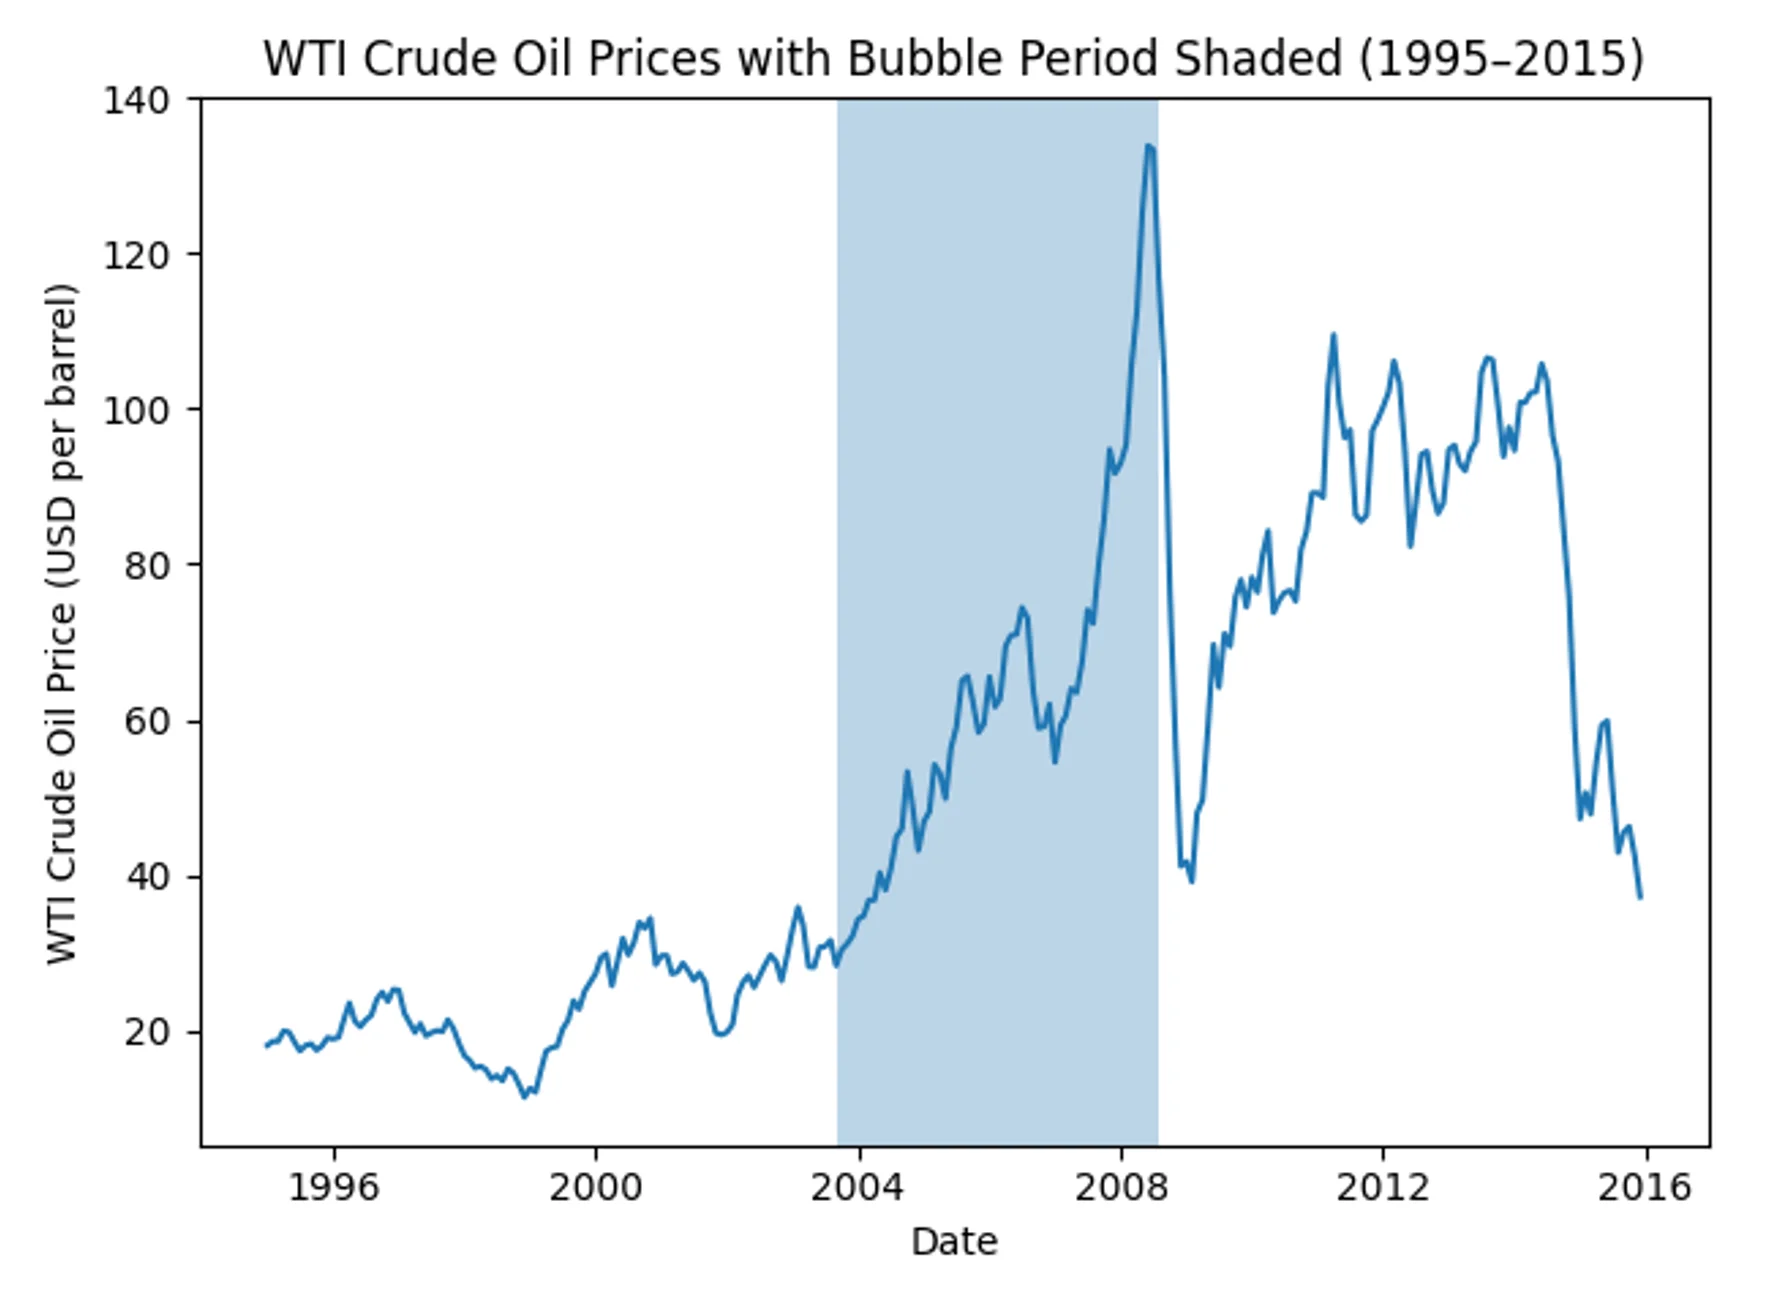
Kejriwal and coauthors also developed an algorithm that can date-stamp multiple bubbles within the same dataset, rather than analyzing them one at a time. Their approach was tested through extensive simulation experiments, where it consistently produced more accurate results with lower bias and error than existing methods. The researchers also applied the algorithm to historical oil price data, demonstrating how it can be used to identify periods of bubble-like behavior in real-world markets.
Kejriwal’s research advances academic work on financial bubbles by improving how they are retroactively dated, while helping policymakers and researchers better pinpoint when periods of rapid price escalation and collapse occur.
“I hope policymakers and researchers take away the importance of getting the timeline of bubbles right and avoid letting hindsight bias shape the narrative. When we look back at past bubbles, more accurate dating helps clarify what economic conditions and policy actions came before a boom, which ones coincided with it, and which ones followed its collapse,” says Kejriwal. “That kind of clarity is essential for learning the right policy lessons.”

