01-21-2026
The calibration of monetary policy requires an estimate of the real neutral rate of interest — what economists call r-star. This is a theoretical real interest rate that is consistent with stable inflation and full employment. In a Taylor rule, when there is no inflation gap or output/unemployment gap, then the Federal Funds rate (FFR) should be set at its neutral value of r-star plus the Fed’s target inflation rate of 2 percent. What is challenging, though, is that r-star must be determined in some manner, and it changes over time.
The level of r-star is central to the debate over whether current monetary policy is accommodative, neutral or restrictive. For example, consider a Taylor rule where we use the Dallas Federal Reserve trimmed mean PCE inflation rate and the CBO natural rate of unemployment. Due to the government shutdown, the most recent trimmed mean PCE is for September and was 2.7. The CBO natural rate of unemployment is 4.5 percent. Using a coefficient of 1.5 for the inflation gap and 0.5 for the unemployment gap, then the FFR should be set to r-star + 3 percent. The current FFR range of 3.5 to 3.75 percent would be consistent with a value of r-star between 0.5 and 0.75. If r-star is lower than 0.5, then current policy is restrictive. Conversely, if r-star is above 0.75, then monetary policy is accommodative.
In an attempt to triangulate r-star’s value, we can look from three different perspectives: macro models, market data, and Federal Open Market Committee (FOMC) views. We start with econometric models estimated on macro data. We examine the estimates of r-star from 2012 to present for three leading models. The first two are the Laubach-Williams (LW) and Holstron-Laubach-Williams (HLW) models that are updated on the Federal Reserve Bank of New York website. Williams is currently president of the NY Fed. The third is the Lubik-Matthes (LM) model, which is updated on the Federal Reserve Bank of Richmond's website.
The estimates from these three models are shown in the Figure below.
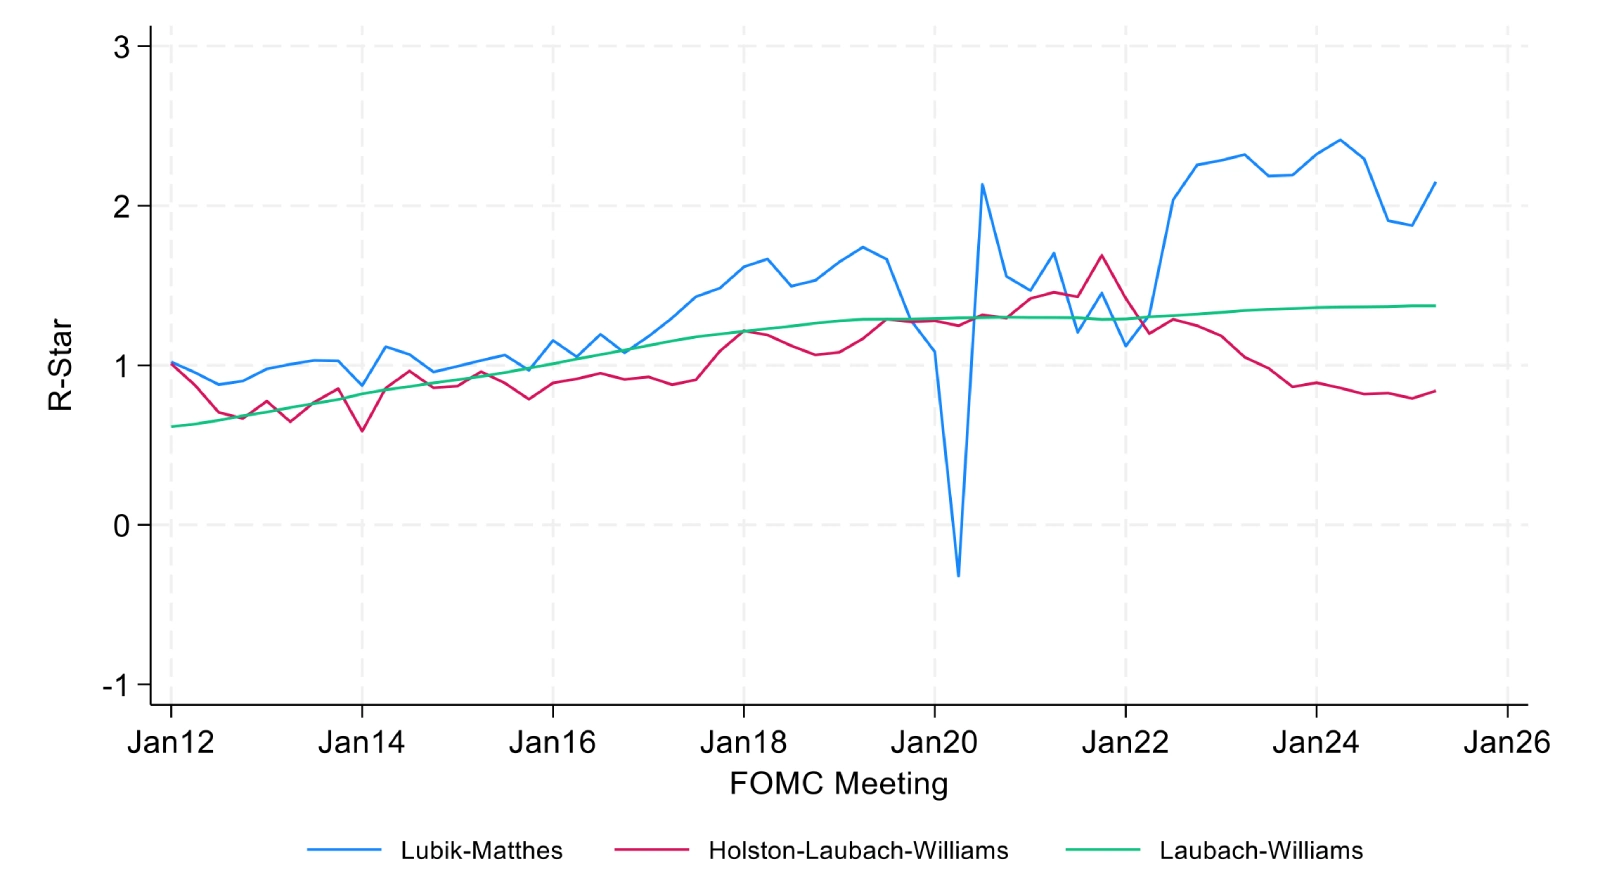
From 2012 to 2017, all three models produced similar estimates of r-star starting in 2012 just below 1 and rising over the next five years to around 1 or a bit higher. However, post-COVID in 2022, two of the models — Lubik-Mathhes and Holston-Laubach-Williams — begin to deviate from each other with the median LM at 2.15 and HLM at 0.8. The Laubach-Williams model produced the smoothest trending estimate of r-star, with a 2025 value of 1.42. Disagreement among the three models has risen sharply starting in 2022.
The second perspective focuses on market pricing and views. This includes information from the yield curve, inflation derivatives, and professional forecasters. An advantage of this approach is that it does not rely on backward-looking and often revised macro data. Two estimates of r-star based on this market perspective are presented by Allocation Strategy. They are shown in the Figure below.
Source: Allocation Strategy calculations, Federal Reserve Board
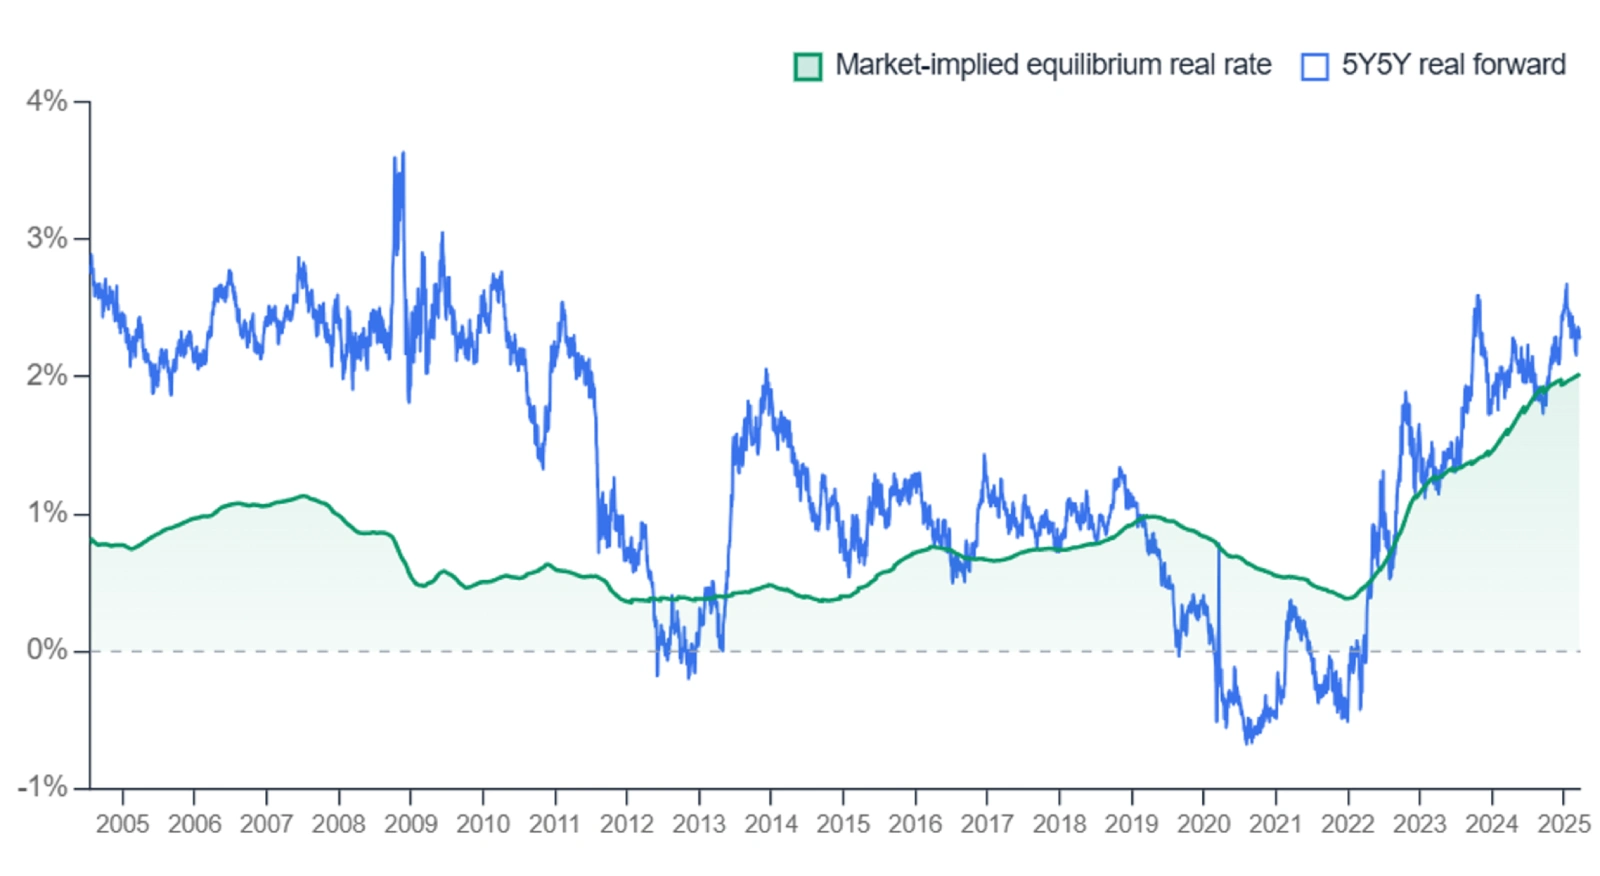
A traditional market-based estimate of r-star is the five-year, five-year forward real interest rate. Allocation Strategy calculates their own estimate of r-star using a broad set of market measures. This is their market-implied equilibrium real rate. If we again begin in 2012, the two measures were quite close, with a value around 0.5 percent. The 5Y5Y real forward measure is more volatile, but both measures had similar values close to 1 percent over Trump’s first Administration. Starting in 2022, the two measures again closely track each other, and by 2025 had increased to around 2 percent (similar to the Lubik-Matthes model-based estimate).
The third perspective is FOMC-based and uses forecasts from the quarterly Survey of Economic Projections (SEP) that the Fed started publishing in 2012. Here we use survey forecasts of the long-run FFR and subtract 2 percent. The survey responses are summarized in the Figure below.
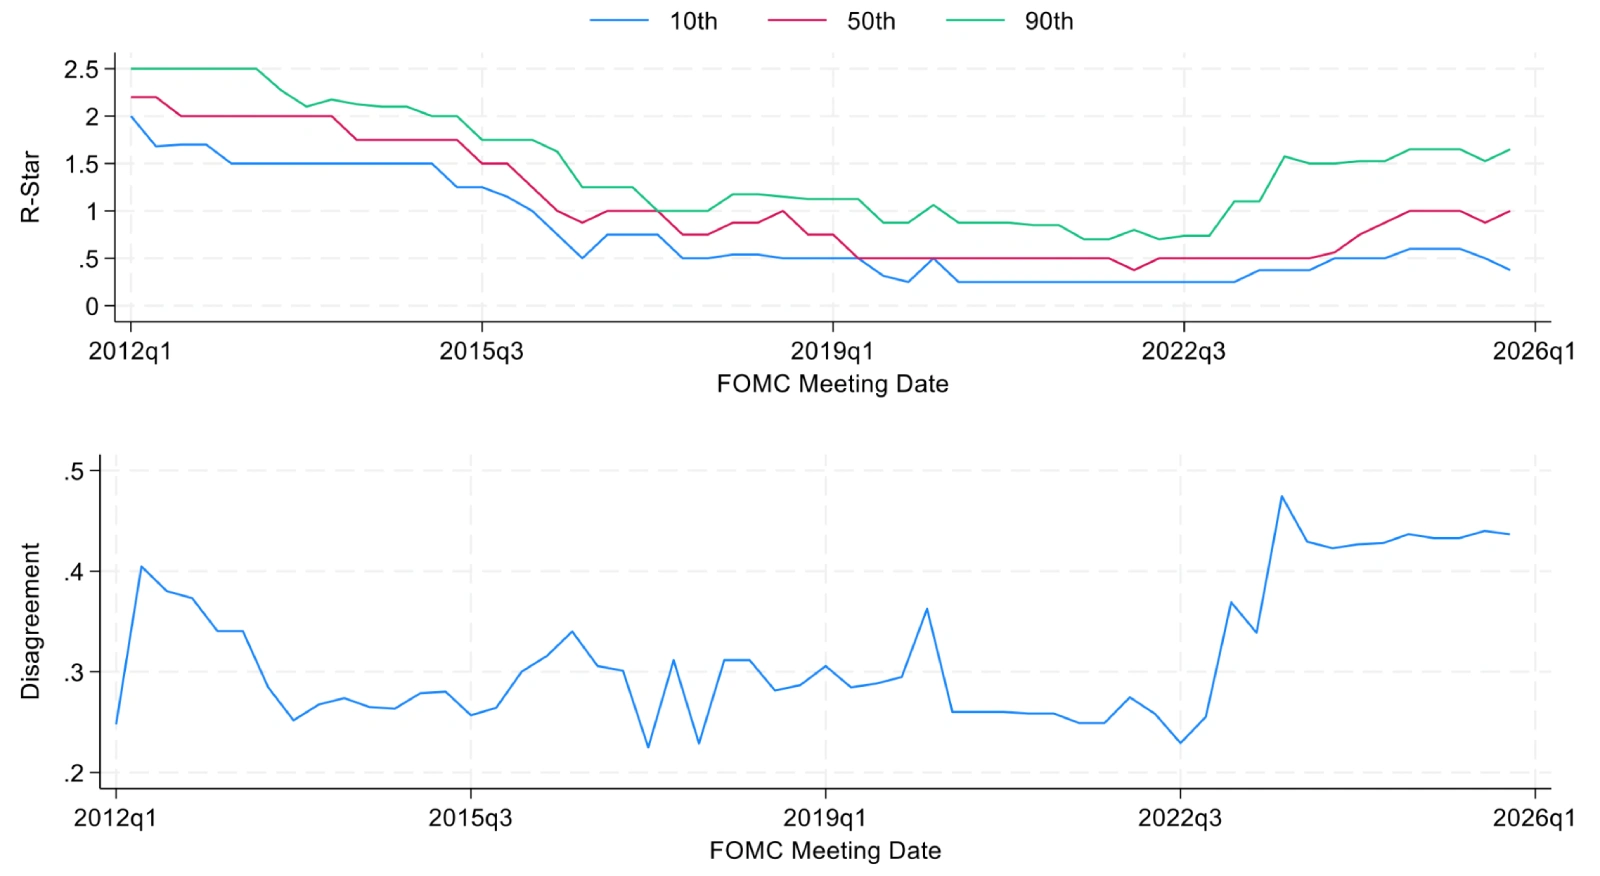
The upper section of the figure shows the time-variation in FOMC estimates of r-star. To reduce the effects of outliers, we look at the 10th and 90th implied values of r-star over time as a measure of dispersion as well as the median value as a measure of consensus. In 2012, the median was 2.25 percent. The median declined, reaching 0.5 percent in 2019, and stayed at this low level until 2024. Over the last two years, the median value has doubled to 1 percent (slightly below the Laubach-Williams model-based estimate). Since 2022, dispersion of FOMC views on r-star has increased with the range between the 10th and 90th percentiles in December 2025 going from a low of 0.375 to a high of 1.65.
The bottom panel of Figure 3 shows a measure of disagreement among FOMC members/participants over their views of r-star. Disagreement is measured by the standard deviation across the r-star estimates in a particular SEP. From 2014 to 2022, disagreement remained relatively constant. Beginning in 2022, disagreement started to increase, nearly doubling by 2023 Q3. This high level of disagreement has continued until the present. This time pattern for disagreement over r-star matches what we saw for two of the model-based estimates that diverged in 2022.
Returning to our earlier question of whether current monetary policy is accommodative, neutral or restrictive: Only the HLW model-based estimate would support the view that current monetary policy is roughly neutral. Two of the model-based estimates, both market-based estimates and the median FOMC view all indicate that r-star is likely between 1 and 2 percent. This range for r-star implies that current monetary policy is accommodative. For inflation to return to 2 percent with an accommodative monetary policy, the drivers of inflation would have to be transitory.
An estimate of r-star is central to calibrating monetary policy. Three different perspectives on r-star suggest that it is likely above 1 percent and may be as high as 2 percent. The high degree of uncertainty in 2025, due in part to Administration policies, has made it even more challenging to pinpoint r-star’s location. This does not mean that we should stop trying. Stephen Hawking said “look up at the stars … be curious.” Let’s hope the FOMC remains curious about r-star in 2026.
Joseph Tracy is a Distinguished Fellow at Purdue University’s Daniels School of Business and a nonresident senior fellow at the American Enterprise Institute. Previously he was executive vice president and senior advisor to the president at the Federal Reserve Bank of Dallas. He regularly contributes insightful posts about financial markets to Daniels Insights.

