07-31-2025
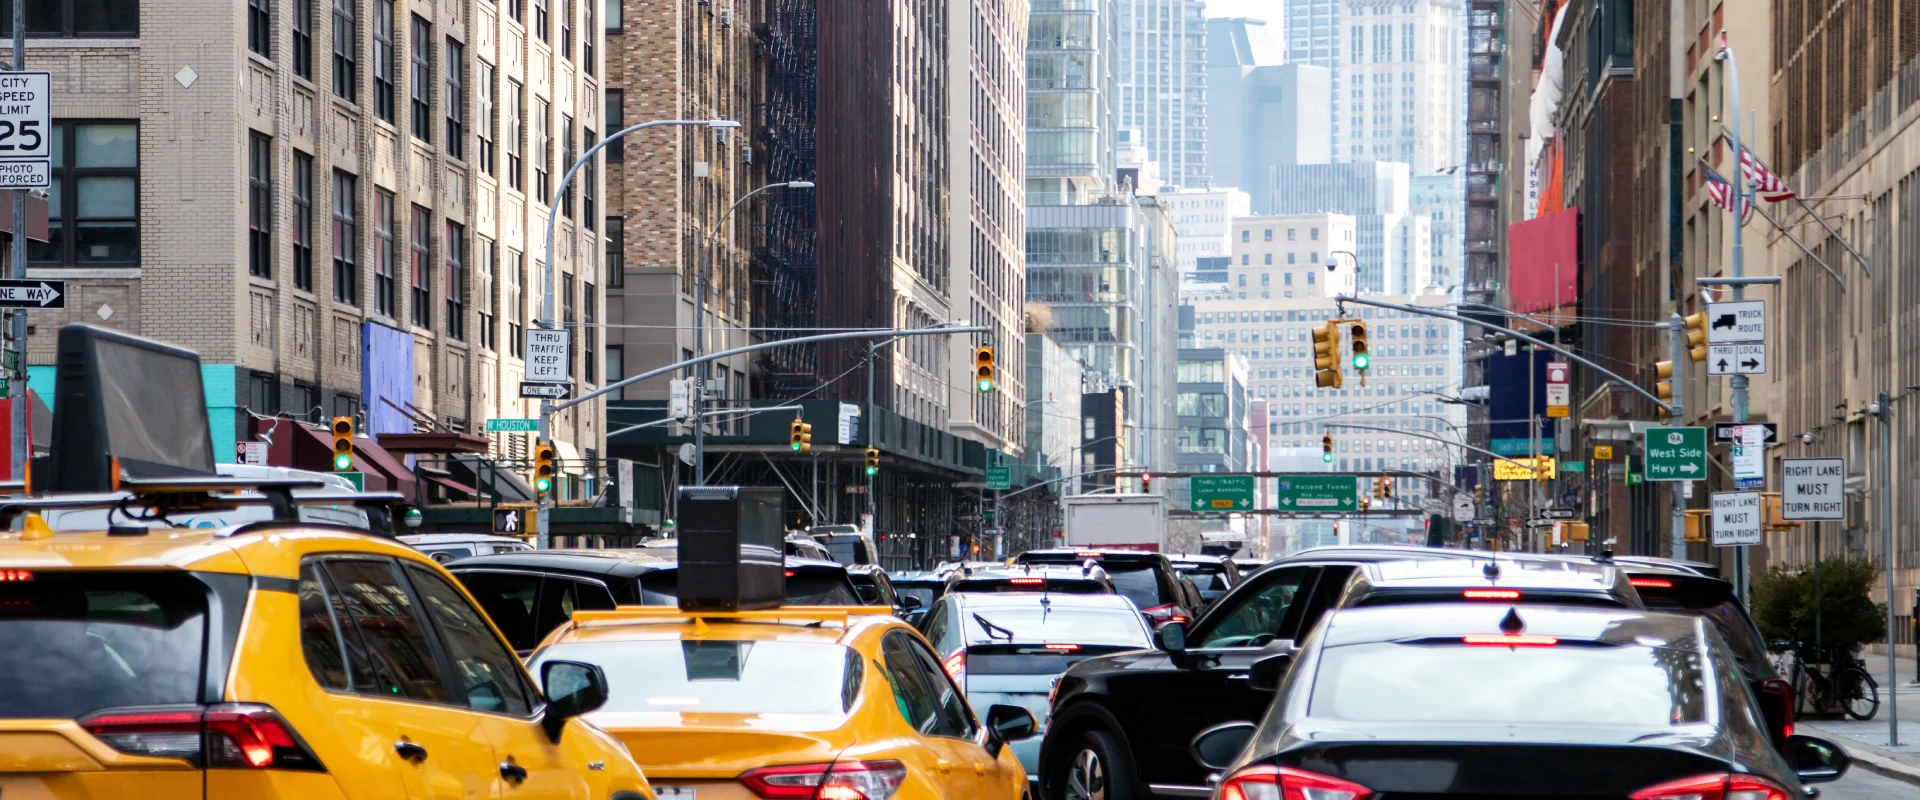
Stuck in traffic and wondering why municipal leaders do not simply add more lanes? In many cities, the binding constraint is peak-period demand, not pavement, suggesting traffic is the symptom of mispriced capacity. This is where academic research adds value; it quantifies demand and evaluates whether policies are equitable and financeable. At the same time, bond issuances providing the necessary capital for infrastructure projects require a network of decisions made by elected officials, economists, credit analysts and investment bankers, thereby shaping the financial blueprints that define our communities.
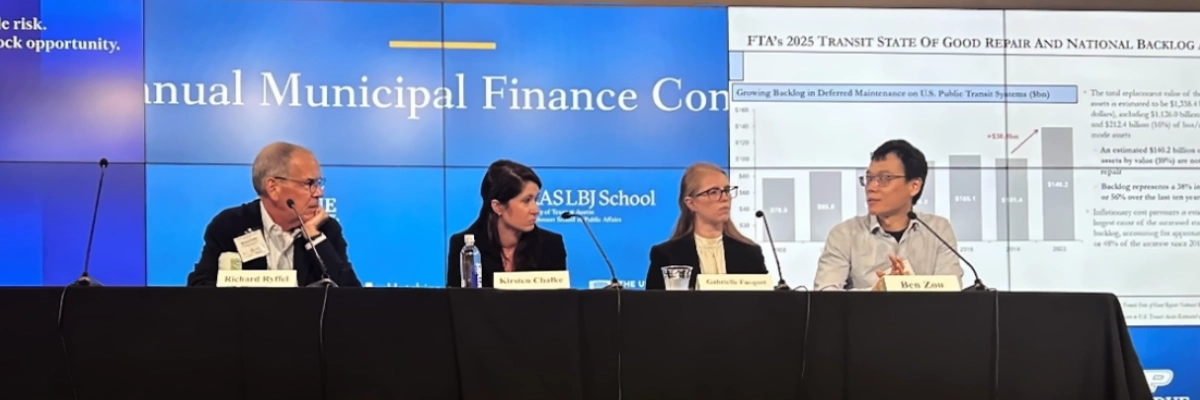
Every summer, the Brookings Institution’s Hutchins Center for Fiscal and Monetary Policy hosts the Municipal Finance Conference, uniting academics, industry professionals and policymakers to unpack recent research on municipal capital markets and fiscal policy. Held in Washington, D.C., July 22-23, the 2025 conference drew leaders from across the public finance ecosystem to discuss the most pressing issues facing municipalities through a series of moderated panels and paper discussions. This year marks the conference’s 14th anniversary; the forum was conceived in 2012 by the Daniels School’s Richard Ryffel and Brandeis University’s Dan Bergstresser.
Ryffel moderated the opening panel, “Has Congestion Pricing’s Time Finally Arrived?” — a timely topic considering New York City’s implementation of congestion pricing earlier this year. A diverse group of experts from industry and academia, including Kirsten Chalke (Jefferies), Gabrielle Facquet (Morgan Stanley), Baye Larsen (Moody’s Investors Service), and Ben Zou (Daniels School of Business), made up the panel. Daniels School students — including Leo Bowman and Gregory Kotsiviras, who documented the panelists' insights — attended the conference and experienced D.C.
Market-based solutions to urban gridlock in NYC trace back to 1952, when William Vickrey, a future Nobel laureate and Columbia economics professor, proposed dynamic fares based on demand for the subway system. Congestion pricing is a textbook application of the Pigouvian tax, a charge used to internalize marginal external costs such as the traffic and pollution produced by commuters.
“Congestion pricing is an elegant solution in that it addresses this negative externality, but then it takes the fees generated to fund a public good,” said Ryffel. The elegance is analogous to tobacco excise taxes: increase prices to curb demand and earmark revenues to mitigate damage through funding public health programs.
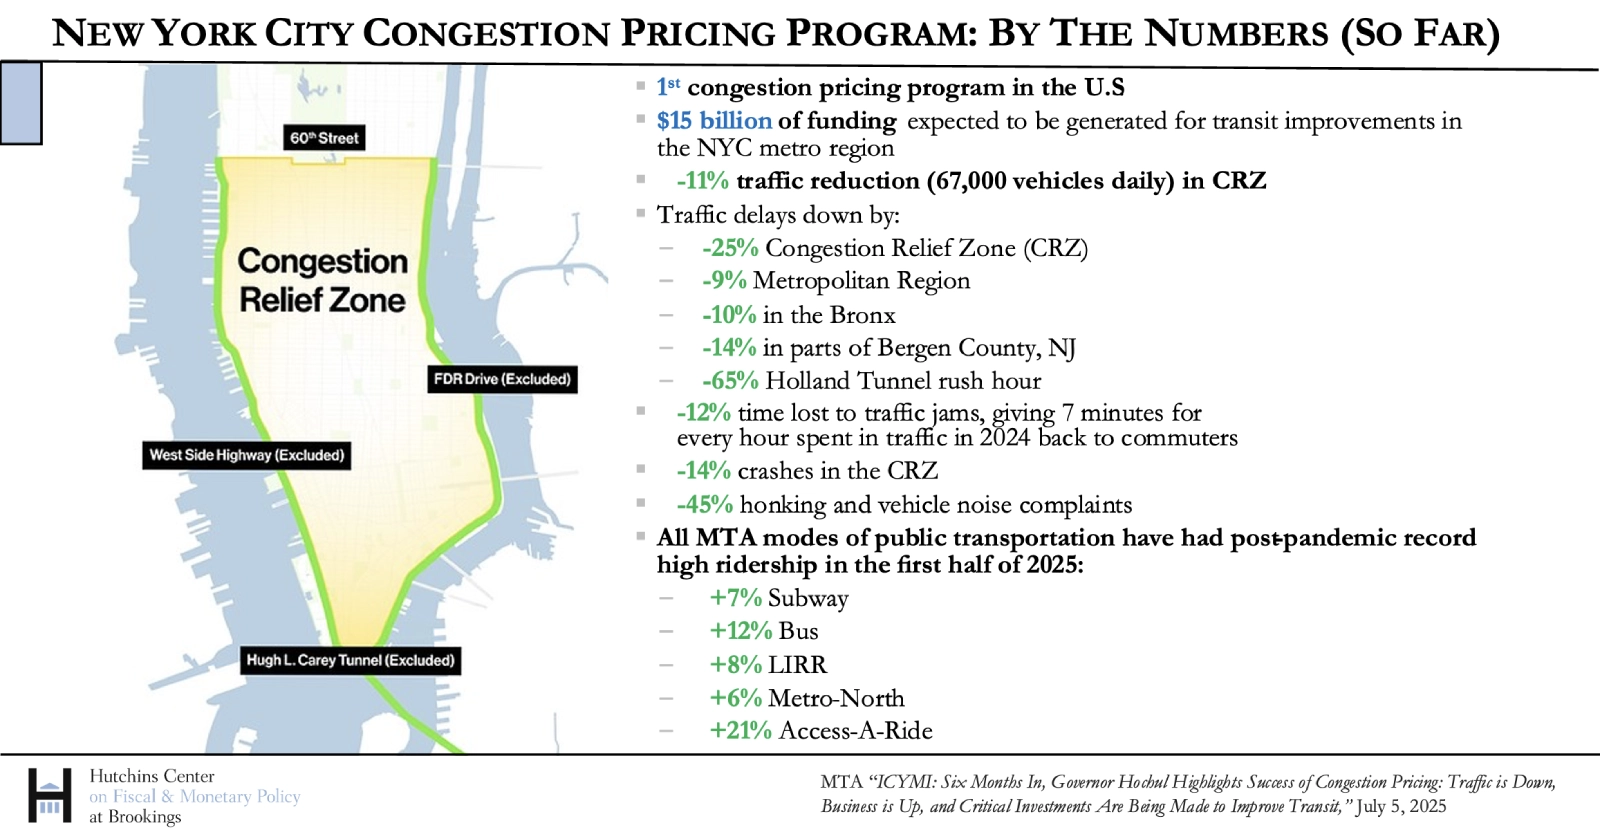
As the concept becomes operational, the conversation at this year’s Municipal Finance Conference centered on whether market signals, revenue stability and credit considerations now validate congestion pricing as a scalable, financeable solution. Early data is encouraging, and a Stanford/Google study indicated material congestion relief with an 11% traffic reduction and 15% increase in speed within the central business district.
Zou referenced comparable congestion pricing programs in London, Stockholm and Singapore, noting that “Global evidence shows that it is overall a success, and people seem to like it.”
Yet, the NYC Metro Transportation Authority (MTA) faces a larger structural challenge as it aims to raise $15 billion for transit improvements. Panelists emphasized that infrastructure capital improvements often come at a cost premium in the U.S.
“To build a mile of transit in this country can cost up to $1-2 billion; in Italy, Paris, Madrid or Istanbul, they are talking $200-400 million," said Chalke.
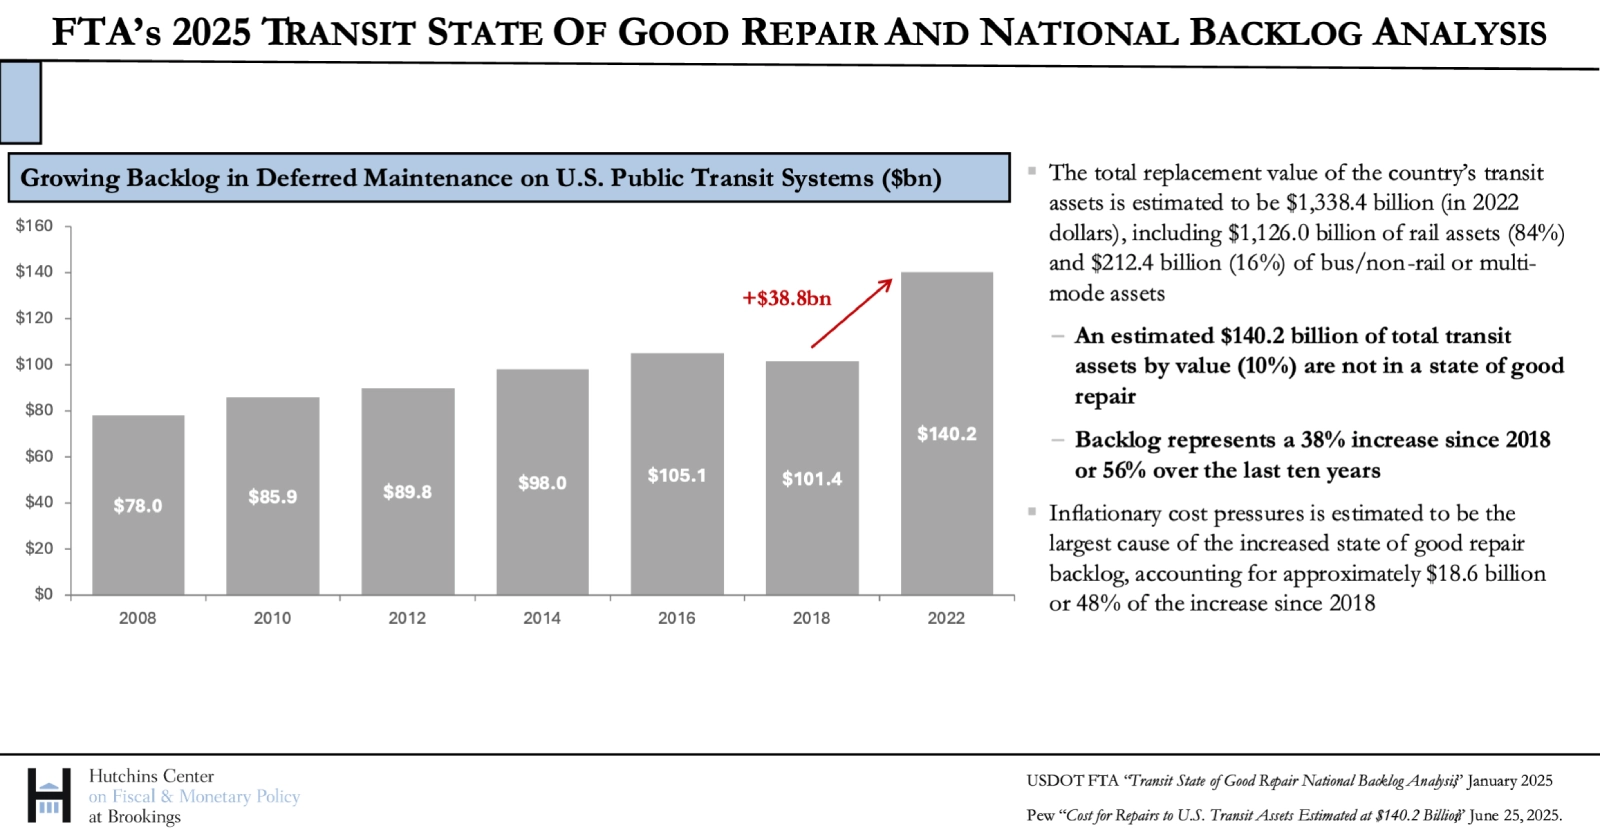
In addition to initiating new projects, funding is in demand to address needed repairs to core infrastructure that has faced decades of deferred maintenance. “The backlog of deferred maintenance has increased to $140 billion since 2018 ... about 50% of that backlog is driven by inflation," said Facquet.
As the compounding effect of aging assets continues, inflationary cost pressures and post-pandemic budget shifts have created a widening reinvestment gap that jeopardizes long-term fiscal sustainability.
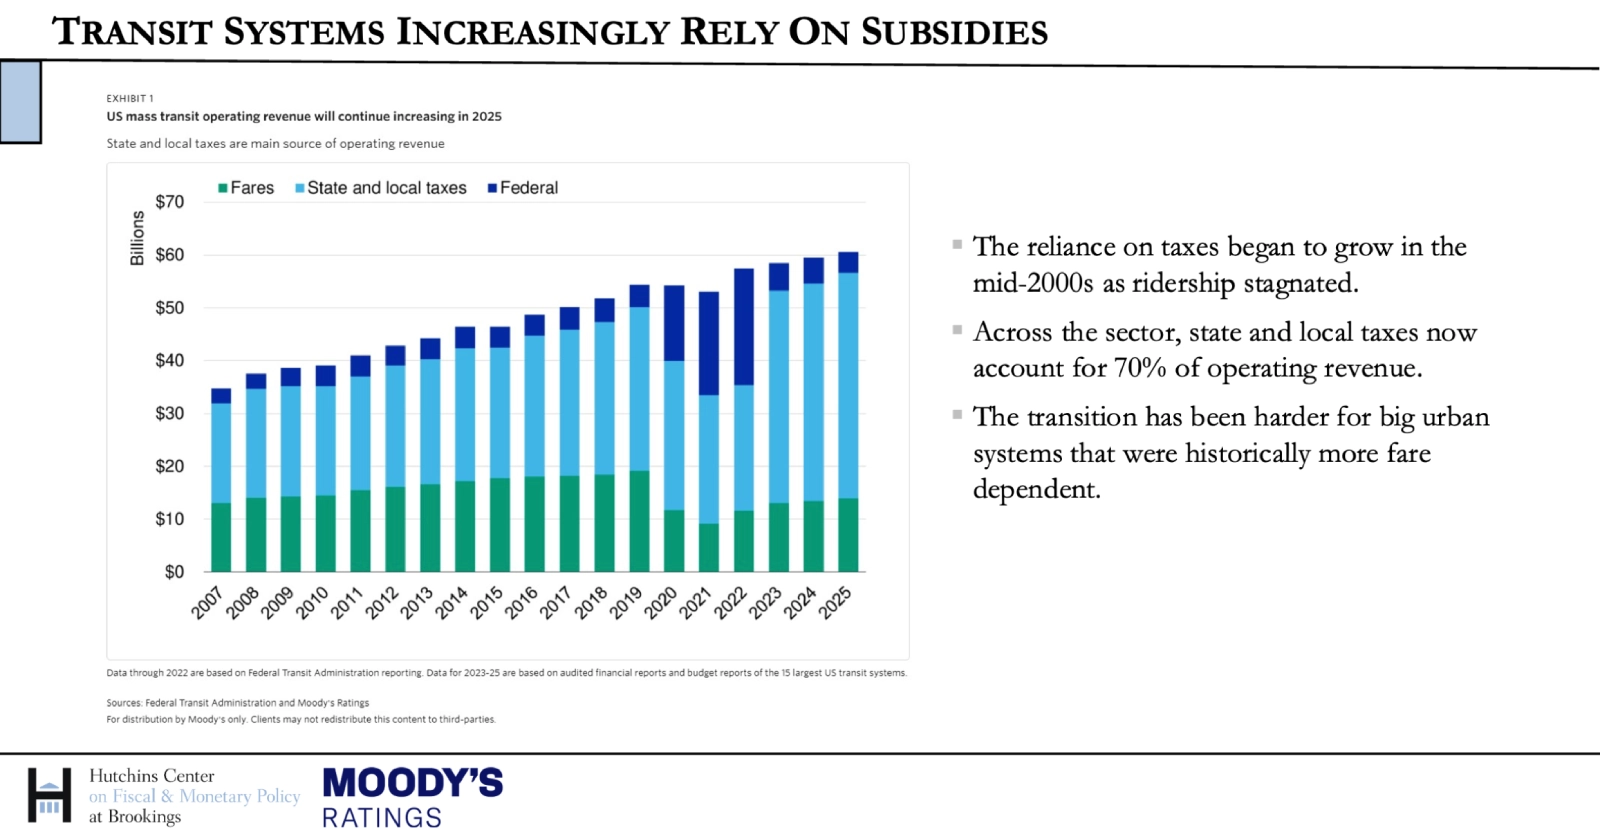
On the operating side, the revenue mix has shifted away from fares and toward subsidies. Ridership has largely plateaued over the past two decades, and during the pandemic, it plummeted. Ryffel noted that when the conference hosted the MTA CFO in July 2020, "Ridership was down 90-something percent. It has not bounced all the way back, which has real implications for operating budgets.”
“COVID was a game-changer, but it was really an extension of a long-term trend," Larsen said, adding that "ridership had been steadily declining since the mid-2000s. If fares are not reliable anymore, that stops being a credit strength.”
For creditors, reliance on subsidies is concerning as political climates become increasingly volatile. Ryffel summarized the policy reality: “Mass transit provides a public good and therefore requires subsidy. That has direct implications for creditworthiness.”
As congestion pricing emerges as a contender to resolve funding issues, equity becomes a key consideration and questions such as who pays and who benefits are at the forefront. Zou offered an economist’s perspective: “We care about welfare, and congestion is just one outcome. The distributional impact is very important. The whole role of public transportation is to equalize access to jobs and homes.”
“If you’re not funding with congestion pricing, some systems are looking at 20 to 40 percent fare hikes, so you have to balance which is more harmful,” said Facquet. While higher fares add pressure on low-income stakeholders, structural barriers such as poor service coverage, limited hours or unsafe conditions pose even greater obstacles to equitable transit access. Reinvesting revenue from congestion pricing into tangible improvements for the rider’s experience builds both public trust and political durability.
While early signals are positive, congestion pricing is in its infancy, and its success hinges on execution. Stagnant ridership, growing infrastructure backlogs and an increasing reliance on subsidies underscore the need for a policy that delivers a fiscally sustainable and equitable solution for commuters. With sound economic rationale, enabling technology and bondable revenue streams, the fundamentals are in place. The question stands: Has congestion pricing’s time finally arrived?