
07-07-2025
It’s graduation and reunion time. The Class of 2025 has much to be thankful for and the Class of 1975 has quite a bit to reminisce about at its 50th reunion. Among other things, the past five decades have seen the development of successful treatments for otherwise fatal diseases and the adoption of healthier lifestyles, both resulting in increased life expectancies. From an economic standpoint, per capita GDP is higher, inflation and unemployment are lower, the U.S. dollar is stronger compared to most foreign currencies, and stock market valuations are higher than in 1975.
Some of these improvements can be attributed to reductions in marginal federal income tax rates, which now provide a greater incentive to work and save. The table below displays the 25 tax brackets for married taxpayers filing jointly in 1975, presented in both nominal and inflation-adjusted terms. The inflation adjustment is made using the Personal Consumption Expenditure (PCE) Price Index.
| Tax rate | 1975 Taxable income | 2025 Inflation-indexed | ||
|---|---|---|---|---|
| Over | But not over | Over | But not over | |
| 14% | $0 | $1,000 | $0 | $4,524 |
| 15% | $1,000 | $2,000 | $4,524 | $9,047 |
| 16% | $2,000 | $3,000 | $9,047 | $13,571 |
| 17% | $3,000 | $4,000 | $13,571 | $18,094 |
| 19% | $4,000 | $8,000 | $18,094 | $36,188 |
| 22% | $8,000 | $12,000 | $36,188 | $54,283 |
| 25% | $12,000 | $16,000 | $54,283 | $72,377 |
| 28% | $16,000 | $20,000 | $72,377 | $90,471 |
| 32% | $20,000 | $24,000 | $90,471 | $108,565 |
| 36% | $24,000 | $28,000 | $108,565 | $126,659 |
| 39% | $28,000 | $32,000 | $126,659 | $144,754 |
| 42% | $32,000 | $36,000 | $144,754 | $162,848 |
| 45% | $36,000 | $40,000 | $162,848 | $180,942 |
| 48% | $40,000 | $44,000 | $180,942 | $199,036 |
| 50% | $44,000 | $52,000 | $199,036 | $235,224 |
| 53% | $52,000 | $64,000 | $235,224 | $289,507 |
| 55% | $64,000 | $76,000 | $289,507 | $343,790 |
| 58% | $76,000 | $88,000 | $343,790 | $398,072 |
| 60% | $88,000 | $100,000 | $398,072 | $452,355 |
| 62% | $100,000 | $120,000 | $452,355 | $542,826 |
| 64% | $120,000 | $140,000 | $542,826 | $633,297 |
| 66% | $140,000 | $160,000 | $633,297 | $723,768 |
| 68% | $160,000 | $180,000 | $723,768 | $814,239 |
| 69% | $180,000 | $200,000 | $814,239 | $904,709 |
| 70% | $200,000 | – | $904,709 | – |
Following is a brief summer school history lesson on the extent to which tax rates and tax liabilities have declined since 1975. All references to taxable income are in 2025 dollars.
In 1975, marginal tax rates ranged from 14 to 70 percent, versus the 10 to 37 percent range under current law. Wages in 1975 were taxed at a maximum rate of 50 percent, and that rate applied to taxable incomes of $199,036 and above. By comparison, someone with taxable income of $199,036 today is at the upper end of the 22 percent bracket. Taxpayers in 1975 were near the current top marginal rate of 37 percent with taxable income of only $108,565; the threshold for the top bracket today is $751,600. This reduction of marginal rates creates a tremendous incentive to earn an extra dollar.
Further, for someone earning $199,036 or more in 1975, marginal tax rates of between 50 and 70 percent were levied on investment income. Today, dividends and interest income are taxed at maximum rates of 23.8 and 40.8 percent, respectively. Consequently, people today have more motivation to save and invest, and they expend less effort searching for unproductive tax shelters.
To get a sense of how these changes in marginal rates have impacted average tax rates (tax liability divided by taxable income), we computed the federal income tax liability for levels of taxable income ranging from $10,000 to $5 million. Those earnings were assumed to have been entirely generated by wages, to avoid making assumptions about the mix of earned and passive income.
The chart below shows average federal income tax rates paid for each income level (logarithmic scale) under the nominal 1975 rate schedule, the inflation-indexed version of that schedule and the schedule under current law. The chart also includes average tax rates computed using the tax rate schedule during the first year in which the changes implemented by the Tax Reform Act of 1986 (TRA) took effect. There were only two tax brackets during the first years following that legislation: 15 and 28 percent.
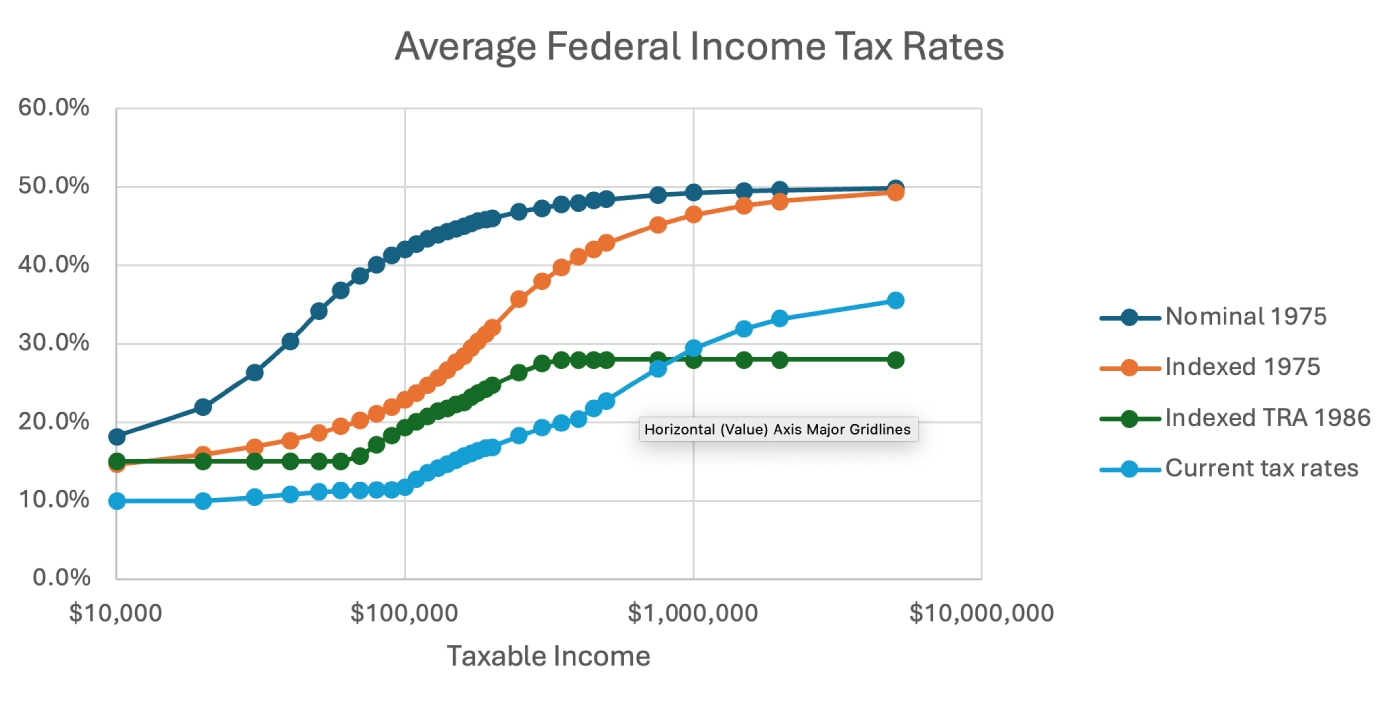
As you can see, when compared to 1975, taxpayers pay dramatically lower average tax rates across all levels of taxable income today than under either the nominal or inflation-adjusted tax rate schedules.
For example, a married couple with taxable income of $100,000 today would pay $42,060 in federal income tax under the 1975 rate schedule and $22,862 if the 1975 brackets were adjusted for inflation, versus $11,828 under current law.
Further, the incentive for that couple to earn more is much greater, since they now pay only 22 percent on the marginal dollar of taxable income, versus 32 percent when the 1975 tax rate schedule is adjusted for inflation and 50 percent when it is not.
A married couple with taxable income of $100,000 pays $19,350 under the TRA 1986 tax rate schedule (indexed for inflation by design), less than under either of the 1975 schedules but $7,522 more than under current law. Those taxpayers also face a “bubble” marginal tax rate of 33 percent, as opposed to the current 22 percent. The “bubble” effective rate results from the method of computing taxable income that is designed to boost the average tax rate to 28 percent. That distortion reduces the incentive to earn an extra dollar when compared to current law.
We should point out that our analysis does not consider the level of Social Security, Medicare and state and local taxes, which may increase aggregate taxes for some but do not attenuate the increased federal incentives to work.
The bottom line: Most taxpayers meeting at their 50th class reunions pay significantly lower average tax rates and keep more of every additional dollar they earn when compared to what they might have dared to hope in 1975. And the economy is much better off as a result. Today’s Class of 2025 may not appreciate how relatively good it has it.
Finally we ask: Did those higher 1975 tax rates put the federal budget in surplus? Alas, they did not. The federal government ran a deficit of $53 billion ($240 billion in today’s dollars) that year, or 3.4 percent of GDP. Today, the deficit is $1.36 trillion, and only going higher.
As is the case today, spending was the problem. Some things never change.
Richard Ryffel is the Executive Director of Business Leadership and a Professor of Practice in the Mitch Daniels School of Business. He is responsible for leading the professor of practice faculty and for outreach to the practice community across multiple functions at the Daniels School. Prior to joining Purdue, he was a Professor of Finance Practice at Washington University in St. Louis, as well as an adjunct instructor at several universities in the U.S. and Europe.
Michael Alderson is an emeritus professor of finance at Saint Louis University.

