
06-17-2025
How important is uncertainty to the formulation of monetary policy?
“Uncertainty is not just an important feature of the monetary policy landscape; it is the defining feature of the landscape,” said Chairman Alan Greenspan in his remarks at the 2003 Jackson Hole Economic Policy Symposium.
New York Fed President John Williams in a speech in March 2025 said, “Uncertainty is the only certainty in monetary policy.”
Atlanta Fed President Raphael Bostic titled his current thinking about the stance of monetary policy “Pervasive Uncertainty Calls for a Patient Policy Stance.”
Given this central role of uncertainty in monetary policy, how does the Federal Reserve communicate to markets and the public its degree of uncertainty over key economic variables? In November 2007, the Fed published for the first time its Survey of Economic Projections (SEP). The SEP is published quarterly and provides point forecasts by Federal Open Market Committee (FOMC) members and participants on a number of economic variables including real GDP growth, the unemployment rate, PCE and Core PCE inflation and the Federal Funds rate. Starting in November 2011, members and participants can indicate if their uncertainty around each outcome is “lower,” “broadly similar” or “higher,” as well as if the risks to that outcome are “weighted to the downside,” “broadly balanced” or “weighted to the upside.” The SEP summarizes this information by providing percentages for each response.
The information on uncertainty provided by the SEP is directional only and does not convey the magnitude of any change in uncertainty. This seems like an important communication gap to fill. In the past, some have used the dispersion of point forecasts as an indicator of uncertainty. However, research has shown that dispersion or “disagreement” is not a good proxy for uncertainty.
How could uncertainty for each FOMC member and participant be measured, summarized and conveyed to markets and the public? There are professional forecaster and household surveys that ask respondents for not just their point forecast on a set of variables, but also for a density forecast. The survey provides a range of possible values for a variable and asks respondents to assign probabilities to each interval. This results in a histogram representation of the respondent’s distribution of possible outcomes for that variable.
As an illustration, the following figure shows the Q4 over Q4 percent growth in Core PCE Inflation density forecasts for two respondents to the 2025 Q1 U.S. Survey of Professional forecasters (respondent 421 and 433).

Respondent 421 (in blue) is more uncertain about Core PCE inflation than respondent 433 (in orange). This is evident from the wider spread in the probabilities assigned by respondent 421 to the possible inflation outcomes.
Measures of the spread of these histograms (variance or distance between the 25th and 75th percentile) can be used as a gauge of the respondent’s level of uncertainty. These individual uncertainty values can then be averaged across respondents. As an illustration, below is the average 1-year ahead inflation uncertainty from the U.S. Survey of Professional Forecasters over three decades.
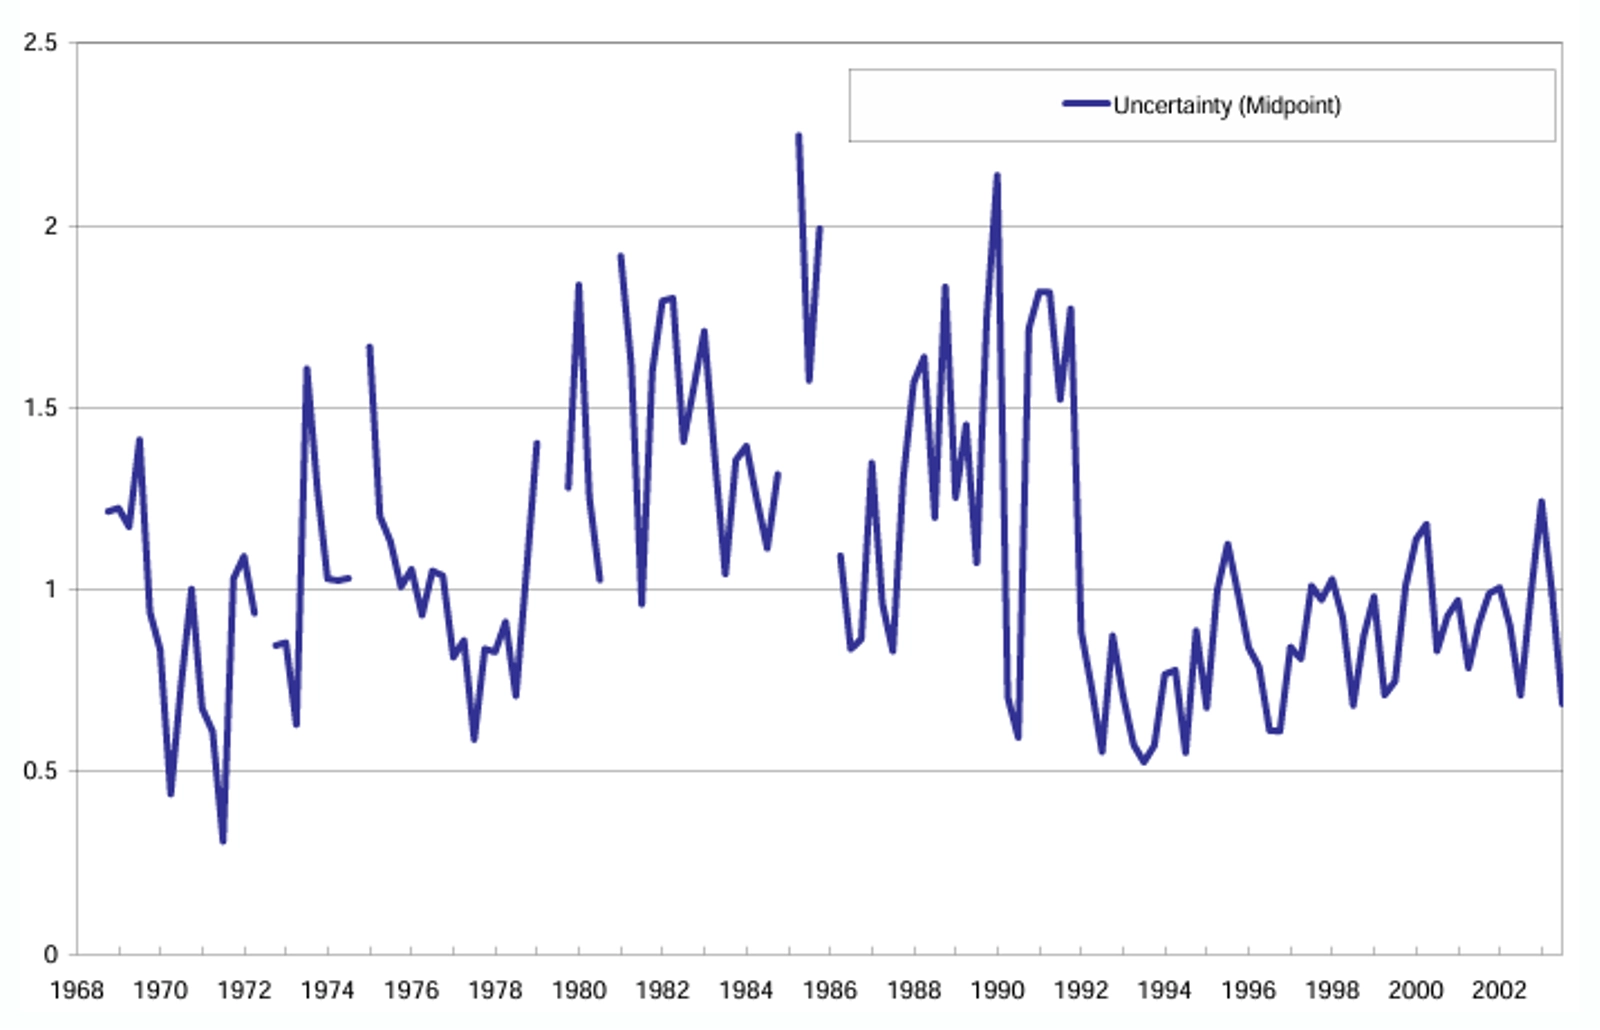
This illustrates that uncertainty is quite volatile over time, but that inflation uncertainty dropped meaningfully and became less volatile a few years after Greenspan became the Fed Chair.
In addition to providing measures of uncertainty, adding density forecasts to the SEP would allow measuring the “balance of risks” — that is, to what extent risks to a variable are tilted to the downside, balanced, or tilted to the upside. Again, the SEP only provides directional information on the balance of risks and not any sense of the magnitude of any upside or downside risks.
The Fed is undertaking a review of their operating framework. It would be helpful if consideration were also given to adding density forecasts to the existing point forecasts in the quarterly SEP. As Yogi Berra said “It’s tough to make predictions, especially about the future.” I’m confident, though, that Yogi could write down his density forecast. Adding density forecasts to the quarterly SEP would help markets and the general public to be more certain about the Fed’s uncertainty.
Joseph Tracy is a Distinguished Fellow at Purdue University’s Daniels School of Business and a nonresident senior fellow at the American Enterprise Institute. Previously he was executive vice president and senior advisor to the president at the Federal Reserve Bank of Dallas. He regularly contributes insightful posts about financial markets to Daniels Insights.

