
07-13-2026
What we can be certain about is that the future is uncertain. This is the essence of forecasting.
To help inform markets to better anticipate Federal Reserve policy, the Fed introduced the Survey of Economic Projections (SEP) in 2007. The SEP provides information on the economic and policy outlooks by Federal Open Market Committee (FOMC) members and participants. Over time, the Fed increased both the frequency (now quarterly) and number of variables covered in the SEP.
In thinking about a respondent’s forecast for a variable such as one-year ahead inflation, the respondent will have a range of possible values each with a subjective probability estimate. The forecast can be summarized as a density of possible values as shown in the chart below.
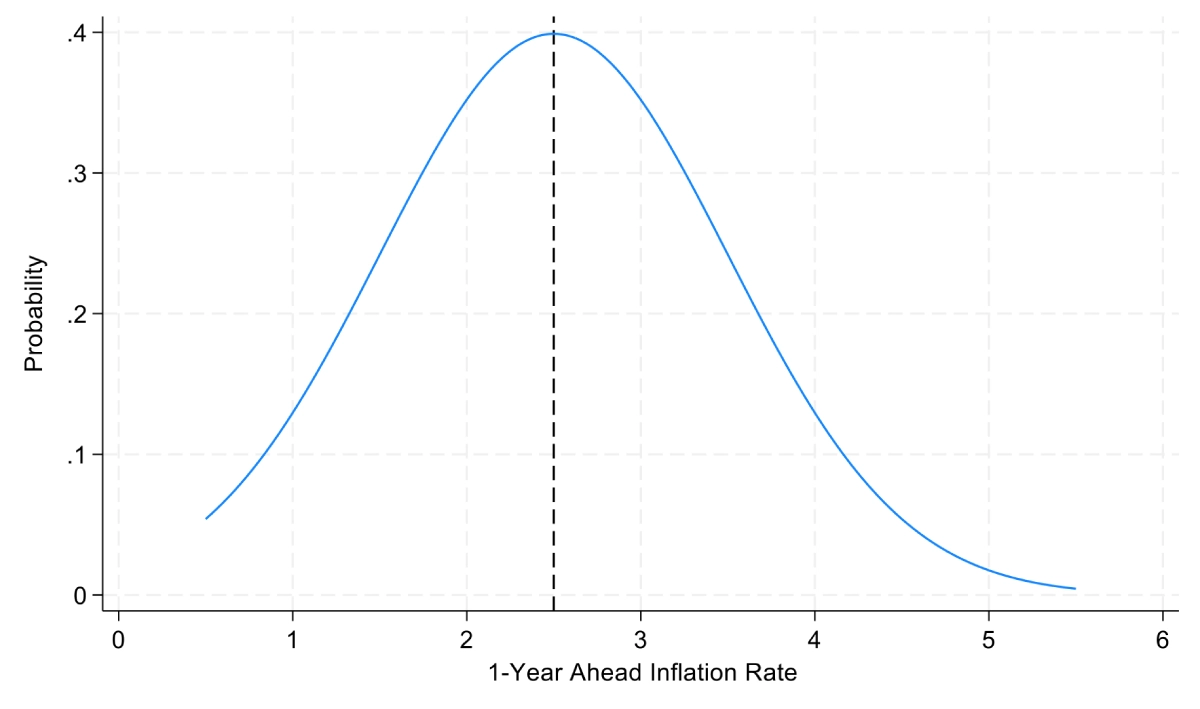
This is a description of the respondent’s density forecast for one-year ahead inflation.
In contrast, a common type of forecast used in surveys including the SEP is a point forecast. Here a respondent must provide one value that summarizes his/her density forecast. A reasonable assumption is that the respondent will provide the value that is “most likely” to occur. In our example above, the respondent would provide a point forecast for one-year ahead inflation of 2.5 percent.
Point forecasts convey only a limited amount of information concerning a respondent’s beliefs about the possibilities for the variable in question. In particular, point forecasts do not indicate the degree of confidence that the respondent has over the forecasted outcome. An example is shown in the chart below where two respondents have the same point forecast for the one-year ahead inflation rate. However, the respondent in blue is much more uncertain about future inflation than the respondent in red. Given the same point forecasts a reader might assume that the two respondents have a similar degree of confidence and, possibly, that this degree of confidence is high.
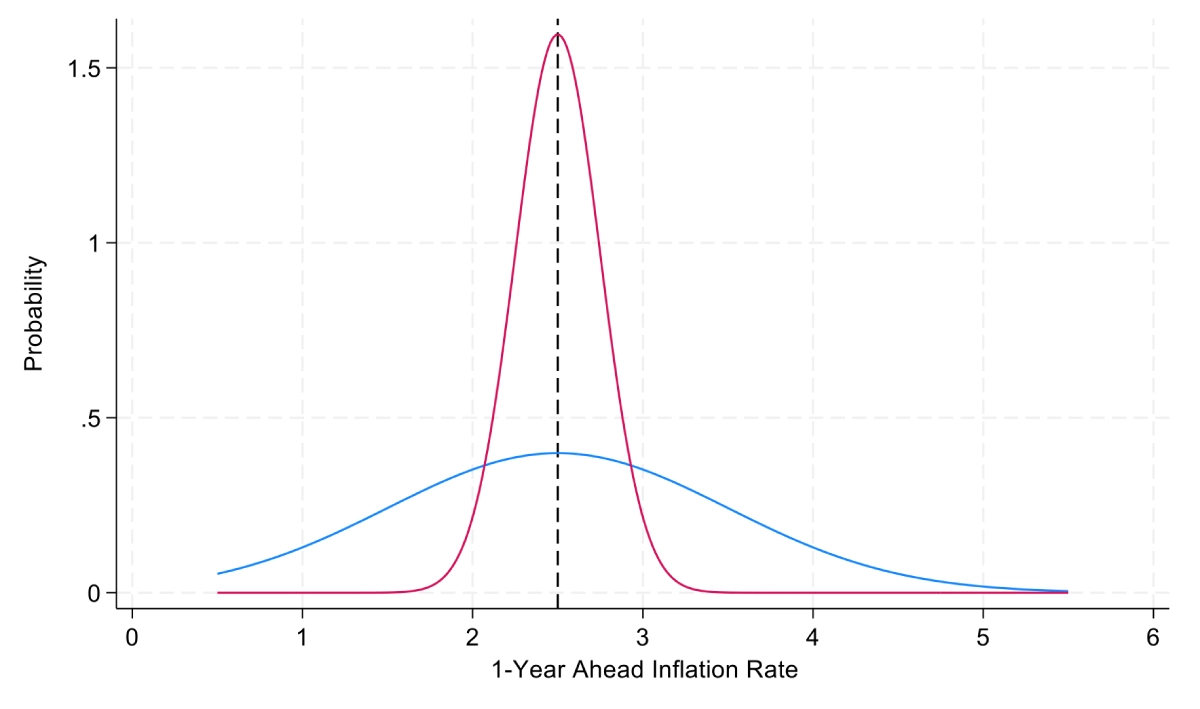
It is tempting to look at the degree of “disagreement” between respondents’ point forecasts as a proxy for the uncertainty of respondents. However, disagreement and uncertainty are separate concepts. In our example above, the two respondents have no disagreement as measured by their point forecasts but have very different levels of uncertainty.
An important consideration for monetary policy is the assessing the “balance of risks” for important variables such as inflation and economic growth. Does the respondent believe that the upside and downside risks are balanced, tilted to the upside or tilted to the downside? The point forecasts do not convey any information about a respondent’s balance of risks. These risk assessments can differ for two respondents who have the same point forecast. In the example shown below, both respondents have point forecasts for one-year ahead inflation equal to 2.5 percent. However, the respondent in blue sees much more upside risks to one-year ahead inflation than the respondent in red.
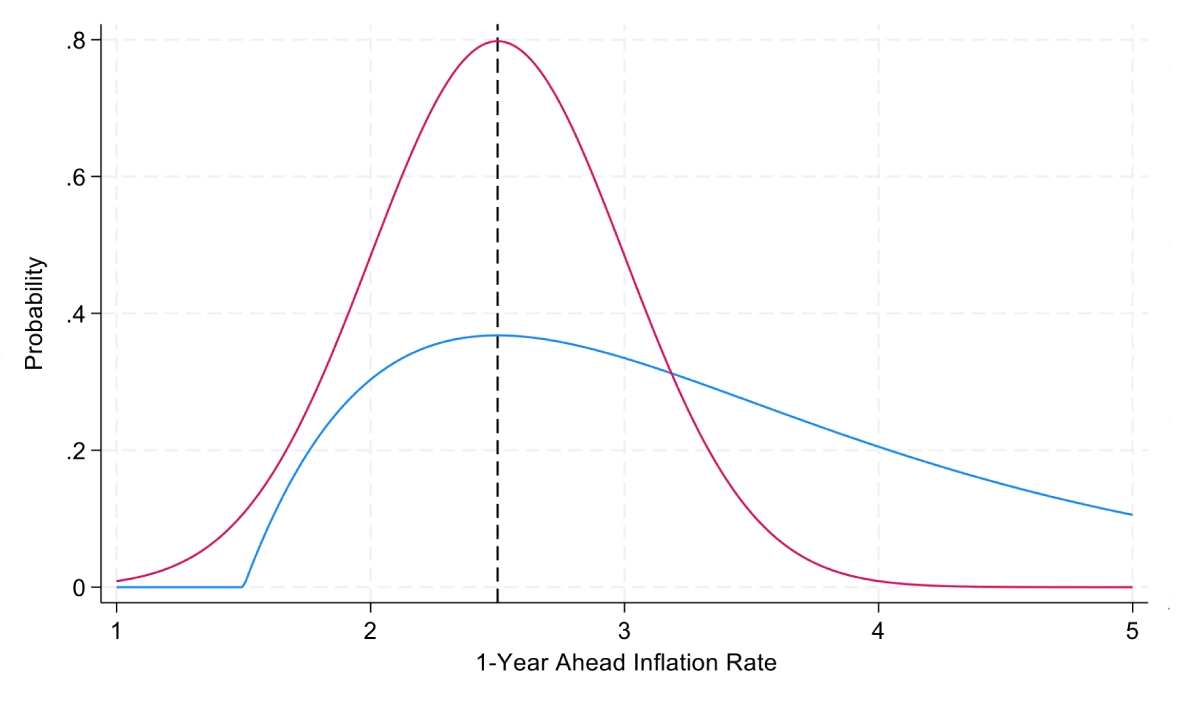
Consequently, the respondent in blue might want to pursue a more restrictive monetary policy stance today to take out insurance against this perceived upside risk to inflation.
On the degree of uncertainty, the SEP provides a count of the number of respondents that respond that uncertainty is lower, broadly similar, or higher than in the last SEP. Similarly, for the balance of risks the SEP provides the number of respondents that respond that risks are weighted to the downside, broadly balanced, or weighted to the upside. This conveys only directional shifts in uncertainty and direction of risk balance with no information regarding the magnitudes.
What is clear from the two simple examples above is that point forecasts are a poor way of conveying information about what FOMC members and participants believe about the possible future outcomes of key variables that affect monetary policy. In addition, the point forecasts can convey a false sense of precision to readers and consequently to markets.
The aim of the SEP is to help markets understand how the FOMC members and participants translate uncertain views about market conditions into monetary policy — their policy reaction functions. In this way, markets can form their own assessments of the evolving market conditions and better understand how Fed policy will react. The goal of the SEP is to help the market to understand the Fed’s policy reaction function, not to promise any path for the policy rate. Achieving this aim for the SEP would be facilitated by the Fed switching from providing point forecasts to density forecasts.
To collect a density forecast for a variable such as one-year ahead inflation, the survey provides a set of intervals for the outcome and asks respondents to fill in the probability that they believe is associated with each interval. The density forecasts from individual respondents in the SEP can be combined together to give an overall aggregate density forecast. This would be much more informative than the current “dot plots” provided in the SEP. More importantly, it would reduce the over focus on the “median dot” that is the center of attention in the business commentary.
Helping the markets to learn about the Fed’s policy reaction function would also be improved by linking a respondent’s density forecasts across the outcomes including the appropriate future policy rates — that is, “connecting the dots.” This preserves the anonymous nature of the SEP but would help markets understand why FOMC members and participants may differ in their density forecasts for the policy rate. Do they have similar policy reaction functions but differ in their density forecasts for inflation and growth/unemployment; or do they have similar density forecasts for these economic variables but different policy reaction functions.
Artists deal with the same problem of how best to convey information. In thinking about changes to the SEP, the Fed could benefit from the insight of the photographer Ansel Adams, who said, “There is nothing worse than a sharp image of a fuzzy concept.” Blurring the “dots” by switching to density forecasts in the SEP would enhance the picture of how the Fed views the economic outlook and translates this into monetary policy.
Joseph Tracy is a Distinguished Fellow at Purdue University’s Daniels School of Business and a nonresident senior fellow at the American Enterprise Institute. Previously he was executive vice president and senior advisor to the president at the Federal Reserve Bank of Dallas. He regularly contributes insightful posts about financial markets to Daniels Insights.