08-13-2024
In a prior post I stressed that the stance of monetary policy depends on the real Federal Funds Rate (FFR), not the nominal FFR that is the focus of press attention. To calculate the real FFR rate you subtract from the nominal FFR a measure of underlying inflation.
Why use a measure of underlying inflation rather than headline inflation for this calculation? Headline inflation can be quite volatile, which would result in an unstable measure of the real FFR. A good measure of underlying inflation should have two properties. The first is that it should be less volatile than headline inflation. The second is that when a gap opens up between headline inflation and a measure of underlying inflation, the gap should close in the future with headline inflation moving toward underlying inflation rather than the other way around.
The most common measure of underlying inflation is “core” inflation that removes food and energy items from the calculation. Prices of food and energy items are often quite volatile, so removing them reduces the variability of core inflation. However, these categories are not always the most volatile, so core inflation is a fairly unsophisticated measure of underlying inflation.
When there are items whose prices increase or decrease significantly more than for others — what we call “outliers”— they can have a disproportionate impact on the average price change or headline inflation. Using the median price change rather than the average (or mean) price change reduces the influence of outliers. The Cleveland Fed publishes a median PCE inflation, which is an improved measure of underlying inflation.
Another strategy for dealing with outliers is to trim them out of the calculation of the mean. This is analogous to having a panel of judges for a sport contest and throwing out the high and the low scores and taking the average of the remaining scores. The Dallas Fed published a trimmed mean PCE inflation rate, which trims out a percentage of the smallest price changes and a percentage of the largest price changes and calculates the mean of the remaining price changes. Unlike core inflation, the trimmed mean does not always trim out all food and energy items.
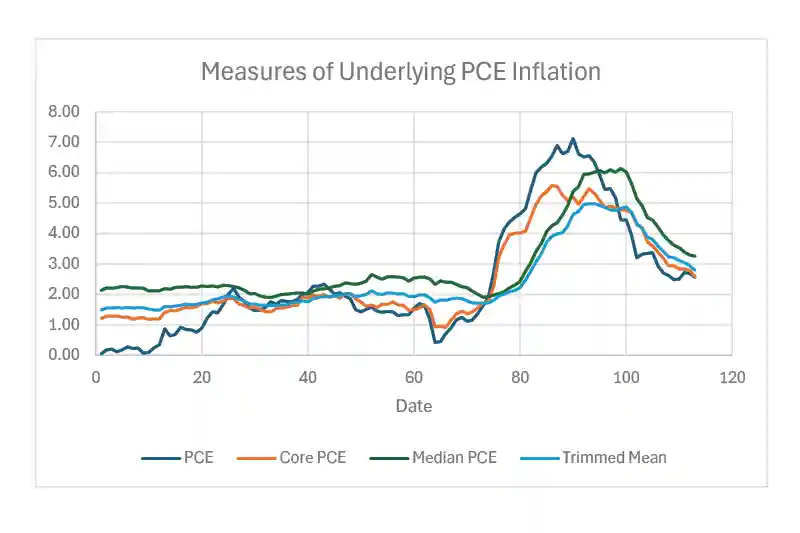
The chart below shows headline inflation and the three measures of underlying inflation. Since January 2015, headline PCE inflation had a standard deviation of 1.92. Of the three measures of underlying inflation, the Dallas trimmed mean has the lowest standard deviation of 1.08 (compared to 1.26 for median PCE and 1.42 for core PCE). Both the Cleveland and Dallas Fed measures of underlying inflation demonstrate the property that gaps with headline inflation are more likely closed by headline converging on the underlying inflation measure.

Using the Cleveland and Dallas Fed measures of underlying inflation, we can return to asking what has happened to the stance of monetary policy over the 12-months since the FOMC last raised the nominal FFR. Over this time period, the Cleveland Fed median PCE has declined 1.43 percentage points and the Dallas Fed trimmed mean PCE has declined 1.36 percentage points. Both changes are slightly smaller than the 1.59 percentage point decline in core PCE inflation. Using these improved measures of underlying inflation, the Fed has held the nominal FFR unchanged, while the real FFR has risen by over a percentage point. Instead of holding the stance of monetary policy, all three measures of underlying inflation indicate that the Fed has instead been tightening monetary policy.
Joseph Tracy is a Distinguished Fellow at Purdue University’s Daniels School of Business and a nonresident senior fellow at the American Enterprise Institute. Previously he was executive vice president and senior advisor to the president at the Federal Reserve Bank of Dallas.