Governing Forecasts Over Time
Forward Validation, Residual Signals, and Forecast Evolution
Forecasts rarely collapse in a dramatic moment. More often, they lose their footing quietly, step by step, while organizations continue to act as if the ground is still firm.
A forecast can still look acceptable in a summary report even as its assumptions weaken, its residuals drift, and its decision value erodes. This chapter shifts the question from “Was the forecast accurate?” to a more important one: Does this forecast still deserve trust for the decision it supports?
A useful analogy is a car dashboard. A driver does not judge vehicle health only by whether the car reached its destination last week. The driver watches ongoing signals—temperature, oil pressure, warning lights, unusual vibration—because those signals indicate whether the system is still safe to rely on now. Forward validation plays the same role in forecasting. It is the dashboard for forecast trust.
Earlier chapters focused on how forecasts are structured, estimated, and interpreted. This chapter moves to a different responsibility: governing forecasts after they are deployed . In practice, organizations do not simply build a forecast once and then accept it forever. They must monitor whether it continues to behave in ways that support responsible action.
That monitoring cannot rely on headline accuracy metrics alone. Measures such as MAE or RMSE summarize what happened in the past, but they do not fully reveal whether a forecast is drifting, whether uncertainty is widening, or whether structural assumptions are weakening. Those questions matter because decisions happen forward in time, not backward.
This chapter therefore frames validation as an ongoing design responsibility rather than a technical checkpoint. Residual behavior, forward validation, and collaborative interpretation become the main tools for deciding whether to maintain a forecast, refit it, or rethink it. In Forecast by Design terms, this is the chapter where trust becomes operational.
This chapter follows the Forecast-by-Design reasoning progression:
Observe → Understand → Practice → Reason → Design → Decide → Integrate → Consolidate → Continue
The learning flow unfolds as follows:
This chapter is designed as a continuous reasoning system. Each component prepares the next.
By the end of this chapter, students will be able to:
How can an organization decide whether a forecast still deserves trust as conditions change over time?
In March 2020, inside Airbnb’s San Francisco headquarters, dashboards that once reflected familiar travel rhythms suddenly turned red. Global bookings collapsed. Summer surges, holiday peaks, and business-travel cycles that had long provided structure no longer behaved as expected. The numbers were real, but the world beneath them had changed faster than the forecasts could recognize.
For years, Airbnb’s forecasting systems had supported pricing, staffing, and investment decisions. They worked not because the future was perfectly predictable, but because the near future usually resembled the recent past closely enough for structure to remain useful. Trend, seasonality, and ordinary uncertainty formed a pattern the company could manage. The pandemic broke that continuity.
At first, the problem looked like an accuracy failure. Forecasts were overshooting demand by enormous margins. But the deeper issue was not simply that forecasts were wrong. It was that they were no longer describing the decision environment. They were still producing outputs, yet those outputs belonged to a world that no longer existed.
Forecast meetings quickly changed in tone. Instead of asking whether forecasts were “accurate,” teams began asking whether they were still meaningful. Analysts, finance leaders, operations planners, and regional managers examined where deviations were growing, whether the deviations were random or systematic, and how quickly the organization would know if assumptions had broken again. The conversation moved from defending numbers to governing trust.
Airbnb responded by shifting from forecast outputs to forecast behavior. Smoothing views were used to see whether demand was stabilizing. Scenario ranges replaced single-point certainty. Internal stress views highlighted where recent errors were clustering and where sensitivity had increased. The goal was no longer to protect one forecast from criticism, but to make uncertainty visible enough to support timely adjustment.
A useful analogy is a bridge under changing weather. A bridge does not become unsafe only when it collapses. Engineers watch for cracks, unusual strain, and subtle movement long before failure. Forecast governance works the same way. Residuals, widening uncertainty, and shifting patterns are like stress signals in the structure. Ignoring them because the bridge still stands is precisely what makes later failure so costly.
By 2021, Airbnb’s bookings were recovering, but confidence did not return because forecasts became perfect. Confidence returned because the company had learned to treat forecasts honestly. Leaders understood when a forecast could guide decisions, when it should be qualified with scenarios, and when it had to be questioned altogether.
This story introduces the central issue of the chapter: the difference between accuracy and reliability, and between a forecast that once performed well and a forecast that still deserves trust going forward.
Organizations often assume that forecasting failure is obvious. In reality, many forecast failures emerge gradually. A model may still produce reasonable average accuracy while becoming less useful for decisions because its errors are becoming directional, clustered, or unstable. This is why governance must focus not only on outputs, but also on behavior over time.
In Forecast by Design, the key memory anchor remains:
Structure → Behavior → Trust
A forecast begins with structure, but it earns trust through behavior. If its behavior changes in ways that matter for decisions, then trust must be reconsidered even before average performance looks disastrous.
Analytical framing
If a retailer relies on an eroding forecast for inventory replenishment, the cost is not just statistical underperformance. It may mean stockouts, overtime, lost sales, or overreaction in the wrong direction.
NorthStar RetailGroup uses weekly sales forecasts to guide replenishment and staffing across regions. Suppose the forecast’s average error remains moderate, but recent weeks show increasingly positive residuals, meaning actual sales keep exceeding forecasted levels. The metric summary may still look acceptable, yet the operational consequence is persistent understaffing and missed replenishment targets.
A common mistake is to assume that one good summary metric proves the forecast is still safe. It does not. A forecast can “score well” while becoming less dependable in the setting where decisions are made.
Forecasting by design asks not only whether the forecast fit the past, but whether it still supports the organization’s next decision responsibly.
To see why this distinction matters, we need to separate accuracy from reliability.
Forecasts fail more often than organizations expect—and usually not for the reasons they assume. In practice, failure is rarely caused by a lack of effort, insufficient data, or poor implementation. More often, forecasts fail because the conditions that once made them useful have changed , while the organization continues to rely on them as if nothing has shifted.
To understand why this happens, it is essential to distinguish between backward-looking accuracy and forward-looking reliability .
Forecast accuracy is retrospective. It evaluates how close forecasted values were to observed outcomes after the fact. Let y t denotes the observed value at time t, and let denote the corresponding forecast. The forecast error is:
This quantity can only be observed after reality has arrived. That makes accuracy useful, but backward-looking.
Two common metrics are used to accumulate forecast errors over a range of time points t .
Mean Absolute Error (MAE)
Root Mean Squared Error (RMSE)
MAE measures the average size of forecast errors, treating all deviations equally regardless of direction. Because it is expressed in the same units as the data, MAE is easy to interpret and communicate. However, MAE does not reveal whether errors are stable over time or whether they are drifting, growing, or becoming systematic—patterns that often matter most for decisions.
RMSE places greater weight on large errors by squaring deviations before averaging. This makes it useful in settings where extreme misses are especially costly. At the same time, RMSE can be dominated by a small number of large shocks. As a result, it may be difficult to tell whether poor performance reflects rare events or deeper structural problems that require different responses.
Both matter. Neither is enough.
A more student-friendly analogy of accuracy is exam grades versus ongoing readiness. A student may have performed well on the last three quizzes, but if they have stopped understanding the newer material, those past grades no longer guarantee readiness for the next exam. Past performance is informative, but it is not the same as current reliability.
A reliable forecast is one that continues to support sound decisions under the conditions in which it is being used. Reliability is not a single metric. Rather, it is an evidence-based judgment about whether the forecast remains interpretable, sufficiently stable to deserve trust, and transparent about its limitations.
In this sense, statistical learning may be viewed as placing considerable emphasis on quantifying reliability through probability distributions, confidence intervals, hypothesis testing, and related inferential tools. Machine learning, in contrast, often places greater emphasis on predictive accuracy. These perspectives are complementary, but they are not identical. Accuracy focuses on closeness to observed outcomes, while reliability focuses on whether a forecast remains trustworthy for decision-making as conditions evolve.
A forecast may still appear accurate on average while becoming unreliable because:
Consider two forecasts:
A decision-maker may prefer Forecast A because it is easier to govern responsibly. This contrast matters because forecasting is not a prediction contest. It is a decision-support system.
In staffing, budgeting, or capacity planning, a forecast that fails slowly is often more dangerous than one that fails obviously. Quiet erosion invites continued trust at exactly the wrong time.
The mistake here is to let backward-looking metrics answer a forward-looking question.
Reliable forecasts are not the ones that were once most accurate. They are the ones that still deserve trust now.
If reliability is not captured by one metric, then what evidence should organizations watch? The answer begins with residuals.
Mathematically, the residual and the forecast error are written the same way:
However, they serve different purposes depending on when and how they are used.
When interpreted empirically as an error, this quantity belongs to backward evaluation. It is summarized, compared, and often minimized to ensure that a selected model fits observed data well.
When interpreted post-implementation as a residual signal, it becomes part of forward validation. It is no longer simply a target for minimization, but a source of insight about how the implemented forecast is behaving over time.
This book adapts this distinction deliberately.
Although error and residual share the same mathematical form, they serve different roles.
Error evaluates the past. Residual monitors the present.
This book builds on traditional error-based evaluation and focuses on forward-looking residuals, not as leftover noise, but as signals for governing forecasts and decisions over time.
Post a forecasting model’s implementation, residuals help answer questions such as:
A useful analogy is a heartbeat monitor. A single heartbeat reveals very little. What matters is the pattern over time. Residuals work the same way. A single miss may be noise, but a sequence of similarly biased misses may signal that something in the system is changing.
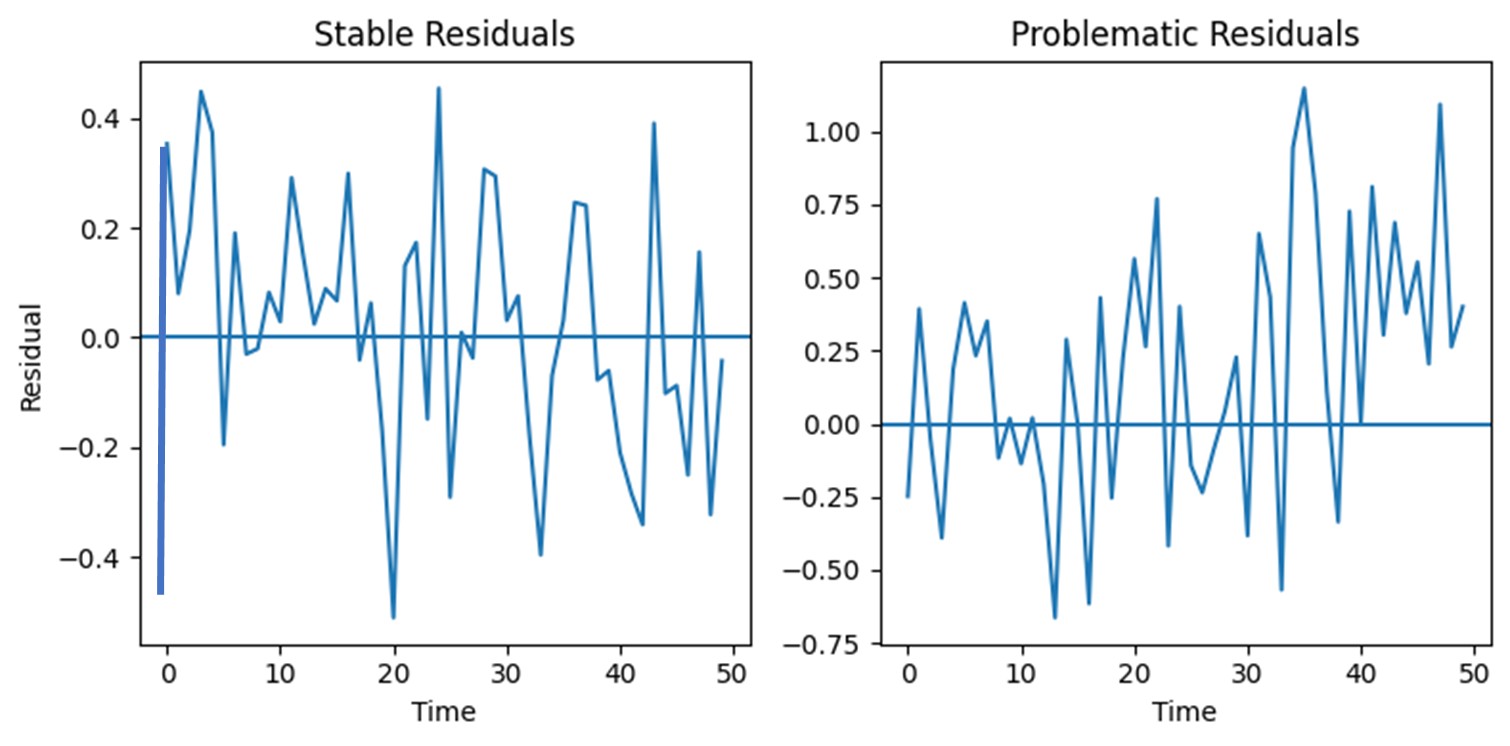
When a forecast structure is deemed as broadly appropriate, residuals tend to:
As time moves forward, residual behavior may begin to change. When residuals:
the forecast may be losing alignment with the reality it is meant to support.
Importantly, these signals do not immediately explain why the change is occurring. However, they do indicate that the level of trust placed in the forecast should be reviewed.
Suppose NorthStar’s weekly sales forecast has historically produced residuals that fluctuate modestly above and below zero. Over the last quarter, however, most residuals are positive and more dispersed than before.
This pattern suggests that actual demand is consistently exceeding forecasted demand. From a decision perspective, this raises the risk of under-ordering inventory, stockouts, and missed sales opportunities.
After forecasts are implemented, a common mistake is to ask:
“How large are the errors?”
without also asking:
“How are the residuals behaving over time?”
The second question is often more valuable for governance because it reveals whether forecast behavior is changing, not just how large individual deviations are.
Residuals are not only scorecards of past performance. They are early warning signals .
They help organizations decide whether to:
In Forecast by Design terms:
Accuracy evaluates the past, but residual behavior governs trust going forward.
Residual interpretation becomes most powerful when combined with forward validation, where behavior is monitored sequentially as new data arrive.
The next section builds on this idea by showing how organizations use forward validation to detect drift, assess stability, and guide forecast evolution over time.
Forward validation evaluates how a forecast behaves as new observations arrive after deployment. Instead of asking only, “How accurate was the forecast over some past period?” forward validation asks:
This matters because time order matters. A shuffled summary of errors may hide drift that becomes obvious when observations are viewed sequentially.
Think of two views of the same forecast:
The first answers, “How large were the misses overall?”
The second answers, “What is happening to trust over time?”
Forward validation is therefore less like grading a finished assignment and more like monitoring a machine in operation. The forecast is already in use. The question is whether it continues to behave in a way the organization can responsibly rely on.
If forward validation reveals growing bias in a demand forecast used for inventory decisions, the organization may need contingency stock, closer review cycles, or a revised replenishment policy before a more formal model revision occurs.
A common mistake is to treat validation as a one-time checkpoint completed before deployment, or to rely on a single error metric in isolation. In practice, forecasts must be validated continuously as they are being used.
Forward validation protects the organization from relying too long on a forecast whose trustworthiness is eroding.
Once we can see forecast behavior over time, the next challenge is to decide what kind of change the evidence supports.
Forecasts are not static products. They are living components of a decision system. As new data arrive, organizations must interpret the evidence and decide whether to:
This decision is not mechanical. It requires judgment about whether observed changes reflect noise, parameter drift, or structural breakdown.
A useful way to understand this progression is to consider how investors could have responded over time during the 2008 financial crisis.
Use this path when residual behavior remains stable and assumptions still appear broadly intact. Small fluctuations are treated as noise rather than evidence of breakdown.
Investor example (pre-2007):
Before the crisis, housing markets and credit models exhibited relatively stable patterns. Residuals were centered, variability was contained, and forecasts aligned with historical assumptions about default risk and diversification.
Interpretation:
Structure, behavior, and trust remained aligned. Maintaining the forecasting framework was appropriate.
Use this path when the underlying logic still appears valid, but recent residual levels are no longer well aligned with modeled period.
Investor example (early 2007–early 2008):
Early warning signals began to emerge:
Many institutions responded by updating models—adjusting default rates, recalibrating risk estimates, or revising short-term forecasts—while maintaining the same structural assumptions.
What this reflects:
An attempt to refit within the existing forecasting structure.
Critical insight:
This period represents a gray zone. The signals could be interpreted as parameter drift—or as early signs of structural change.
Use this path when diagnostics suggest a deeper mismatch. Residual drift, widening dispersion, or new forms of dependence indicate that the structure itself may no longer reflect reality.
Investor example (mid–late 2008):
As the crisis intensified:
At this point, the issue was no longer parameter misalignment—it was structural failure.
What should have happened earlier:
Rethinking the forecasting framework:
What happened when rethinking was delayed:
Refitting asks:
“Can this structure still work if we update it?”
Rethinking asks:
“Should this structure still be trusted at all?”
This distinction is central.
A useful analogy is medical diagnosis:
Organizations often remain in refit mode too long, even when evidence points toward the need for rethinking. This happens because refitting:
However, delaying rethinking increases decision risk.
If NorthStar observes a mild upward bias as product demand grows, refitting—such as updating recent trends—may be sufficient.
However, if residuals also widen significantly, seasonal patterns weaken, or demand timing shifts unpredictably, the issue may no longer be parameter adjustment. In this case, the forecasting structure itself may need to be reconsidered.
A common mistake is misclassifying the signal:
The more subtle and costly error is remaining in refit mode when the evidence already points to structural breakdown.
Forecast evolution is not a failure of analysis. It is evidence that the organization is governing trust over time.
In Forecast by Design terms:
Models don’t decide—systems do.
The critical capability is not just detecting change, but deciding when that change is structural enough to require rethinking.
This judgment cannot be learned from definitions alone. It develops through practice.
In the next SkillBox, you will examine residual behavior directly and learn how to translate diagnostic patterns into decision-relevant language—deciding whether to maintain, refit, or rethink in a realistic setting.
Using diagnostics to monitor trust over time
Purpose
This SkillBox develops practical skill in interpreting residual behavior as a governance signal in an active forecasting system. The emphasis is on monitoring, interpretation, and judgment, not on model construction or parameter tuning.
NorthStar Context
NorthStar RetailGroup has already deployed a weekly sales forecast to support replenishment and staffing decisions. The issue now is not how to build the forecast, but whether it continues to deserve trust as new evidence arrives.
Decision Stakes
If NorthStar keeps relying on a drifting forecast, inventory decisions may lag true demand, staffing may become misaligned, and managers may react too late to emerging change.
Dataset
Use the primary dataset and the file: essentials_sales_residuals.csv
Expected fields:
What You Will Do
Implementation
Python
import pandas as pd
import matplotlib.pyplot as plt
# Step 1: Load forecast outputs and residuals
df = pd.read_csv("essentials_sales_residuals.csv")
required = {"week", "residual", "source"}
missing = required - set(df.columns)
if missing:
raise ValueError(f"Missing required columns: {missing}")
df["week"] = pd.to_datetime(df["week"])
df = df.sort_values("week").reset_index(drop=True)
# Create a cleaner label
df["period"] = df["source"].replace({"future_simulated": "post"}).where(df["source"] != "history", "history")
hist = df[df["period"] == "history"]
post = df[df["period"] != "history"]
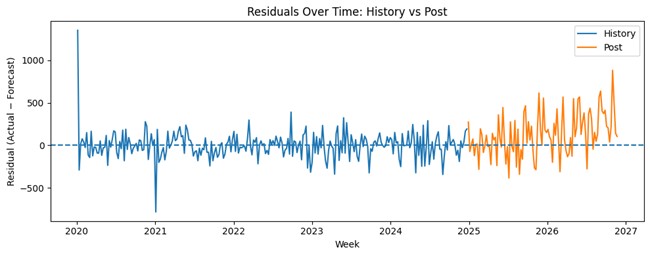
# Step 2: Residuals over time
plt.figure(figsize=(10, 4))
plt.plot(hist["week"], hist["residual"], label="History")
plt.plot(post["week"], post["residual"], label="Post")
plt.axhline(0, linestyle="--")
plt.xlabel("Week")
plt.ylabel("Residual (Actual − Forecast)")
plt.title("Residuals Over Time: History vs Post")
plt.legend()
plt.tight_layout()
plt.show()
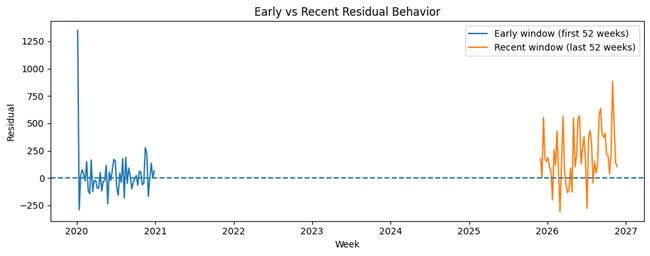
# Step 3: Compare early vs recent windows
early_n = 52
recent_n = 52
early = df.iloc[:early_n]
recent = df.iloc[-recent_n:]
plt.figure(figsize=(10, 4))
plt.plot(early["week"], early["residual"], label=f"Early window (first {early_n} weeks)")
plt.plot(recent["week"], recent["residual"], label=f"Recent window (last {recent_n} weeks)")
plt.axhline(0, linestyle="--")
plt.xlabel("Week")
plt.ylabel("Residual")
plt.title("Early vs Recent Residual Behavior")
plt.legend()
plt.tight_layout()
plt.show()
# Plain-language summary anchors
def summarize(window_df, name):
r = window_df["residual"].dropna()
return pd.Series({
"window": name,
"mean_residual": r.mean(),
"std_residual": r.std(),
"pct_positive": (r > 0).mean()
})
summary_tbl = pd.DataFrame([
summarize(early, "early"),
summarize(recent, "recent")
])
print(summary_tbl.to_string(index=False))R
library(ggplot2)

# Step 1: Load forecast outputs and residuals
df <- read.csv("essentials_sales_residuals.csv", stringsAsFactors = FALSE)

required <- c("week", "residual", "source")
missing <- setdiff(required, names(df))
if (length(missing) > 0) {
  stop(paste("Missing required columns:", paste(missing, collapse = ", ")))
}

df$week <- as.Date(df$week)
df <- df[order(df$week), ]

df$period <- ifelse(df$source == "history", "history", "post")

# Step 2: Residuals over time
ggplot(df, aes(x = week, y = residual, color = period)) +
  geom_line() +
  geom_hline(yintercept = 0, linetype = "dashed") +
  labs(
    title = "Residuals Over Time: History vs Post",
    x = "Week",
    y = "Residual (Actual − Forecast)",
    color = ""
  ) +
  theme_minimal()

# Step 3: Early vs recent windows
early_n <- 52
recent_n <- 52

early <- df[1:min(early_n, nrow(df)), ]
recent <- df[max(1, nrow(df)-recent_n+1):nrow(df), ]

early$window <- paste0("Early window (first ", nrow(early), " weeks)")
recent$window <- paste0("Recent window (last ", nrow(recent), " weeks)")

df_windows <- rbind(early, recent)

ggplot(df_windows, aes(x = week, y = residual, color = window)) +
  geom_line() +
  geom_hline(yintercept = 0, linetype = "dashed") +
  labs(
    title = "Early vs Recent Residual Behavior",
    x = "Week",
    y = "Residual",
    color = ""
  ) +
  theme_minimal()

summarize_window <- function(d, name) {
  r <- d$residual
  data.frame(
    window = name,
    mean_residual = mean(r, na.rm = TRUE),
    sd_residual = sd(r, na.rm = TRUE),
    pct_positive = mean(r > 0, na.rm = TRUE)
  )
}

summary_tbl <- rbind(
  summarize_window(early, "early"),
  summarize_window(recent, "recent")
)

print(summary_tbl)
Key Outputs
window  mean_residual  std_residual  pct_positive
 early      27.538462    221.267247      0.461538
recent     209.445012    247.123363      0.846154
Interpretation
This pattern suggests that recent residuals are not merely fluctuating randomly. They are more positive on average and slightly more dispersed, which raises concern that the forecast may be underestimating recent demand and becoming less reliable for current decisions.
Error Interpretation
Do not treat these summary values as automatic thresholds. They are interpretive anchors. Their purpose is to support discussion about drift, stability, and trust.
Common Pitfall
A common pitfall is to jump directly from visible drift to “the model is broken.” Residual change is a warning signal, not a self-explaining diagnosis.
Decision Design Insight
A statement such as “recent residuals are more positive and less stable than the earlier window” is often more decision-useful than “RMSE increased by 8%.” The first statement speaks to readiness and risk; the second often remains trapped inside technical reporting.
Reflection
Bridge to LearningLab
The next step is to use AI as a reasoning partner—not to make the decision, but to help widen the interpretation of what these residual patterns might mean.
Residual drift, uncertainty, and forward validation
This LearningLab reinforces the central idea of Chapter 6:
Forecasts are not validated once—they are governed continuously through their behavior over time.
Building on the SkillBox, where you examined residual patterns, this LearningLab uses AI as both a learning partner and a thinking partner to deepen your ability to:
The objective is to:
This LearningLab reinforces:
AI is not used to evaluate the forecast for you.
It is used to expand the space of possible interpretations—while responsibility remains yours .
In the preceding SkillBox, you observed residual behavior across time and compared early and recent performance.
You likely saw that:
This LearningLab addresses the key shift of the chapter:
Validation is not a retrospective score—it is an ongoing assessment of whether a forecast still deserves trust.
AI is used here to:
Key principle:
Residuals are not just measurements—they are early warning signals in a decision system.
NorthStar analysts have completed a formal residual review.
At first glance:
But operational signals suggest otherwise:
Residual diagnostics reveal:
This creates a critical governance question:
Is the forecast still reliable for the decisions it supports?
Key questions include:
To support this reasoning, analysts use AI to:
AI does not determine trust.
It helps you interrogate the evidence more rigorously.
You will engage with AI at three levels:
Reinforce → Extend → Explore
Work through the modes in order.
Strengthen your understanding of validation as a forward-looking process.
“Key Concepts from Chapter 6.
“I understand why validation must be forward-looking and behavior-based.”
Extend your ability to interpret and diagnose forecast behavior.
Optionally explore additional analytical concepts or methods that interest you but not covered in the chapter.
“I can evaluate whether a forecast is behaving in a way that supports trust.”
Translate diagnostic evidence into decision action.
“I understand how validation informs decision timing and accountability.”
After completing all three modes:
The goal is to govern trust—not compute metrics.
Prepare a structured summary (200–300 words) including:
Your response should connect:
diagnostics → interpretation → decision implication
You must:
Principle:
AI can expand interpretation—but cannot assume responsibility for decisions.
Residuals serve two fundamentally different roles:
Forward validation emphasizes:
A well-functioning forecast produces residuals that:
When these conditions weaken:
AI can:
But cannot:
Insight:
A forecast does not fail when accuracy declines.
It fails when its behavior no longer supports responsible decisions.
You have now moved from:
diagnostic observation → interpretive reasoning
The next step is:
designing how organizations act on these signals
How should residual evidence translate into:
The DesignStudio moves from:
understanding → reasoning → decision system design
From diagnostics to decision rules
This DesignStudio develops your ability to design a governance process for forecast trust rather than merely interpret one set of diagnostics.
NorthStar RetailGroup uses weekly forecasts to guide replenishment, labor planning, and promotion readiness. Residual reviews currently occur informally, and managers worry that warning signs may be noticed too late.
How should NorthStar design a process for monitoring forecast behavior, escalating concerns, and deciding when to maintain, refit, or rethink a forecast?
Develop a governance design that addresses the following:
Prepare a one-page governance blueprint with:
Good governance does not eliminate uncertainty. It creates a repeatable way to surface uncertainty early enough for responsible action.
You have now practiced interpretation and designed a governance system. The next step is to decide what to do in a realistic situation where forecast trust is already beginning to erode.
Governing forecasts under changing conditions
A national logistics company uses weekly shipment-volume forecasts to plan staffing, routing, and warehouse capacity. The forecasting system has been stable for more than a year and remains widely trusted across operations.
Recently, managers have reported growing strain. Staffing shortages are more common, expedited shipping costs are increasing, and service-level targets are being missed, even though the forecast still appears acceptable on average in summary reports.
Analysts reviewing recent diagnostics notice that residual variance has increased and that the most recent residuals show mild but persistent upward drift. No system outage or obvious data-quality failure has been identified.
How should the organization interpret these signals and decide whether the forecast still deserves trust for near-term operational decisions?
As a cross-functional review group, answer the following:
Write a short executive note that recommends one path—maintain, refit, or rethink—and justifies it in terms of trust, preparedness, and risk.
Forecast breakdowns rarely announce themselves with one dramatic miss. More often, they appear as subtle changes in residual behavior that only become meaningful when interpreted collaboratively and linked to decision risk.
Forecast evolution is not about fixing models—it is about governing trust as conditions change. Residual behavior reveals whether a forecast’s structure still aligns with reality, guiding decisions to maintain, refit, or rethink. Models don’t decide—systems do, and the most critical judgment is recognizing when change is structural rather than temporary.
At NorthStar RetailGroup, the forecasting process now includes a formal monthly residual review rather than relying only on periodic accuracy summaries. Regional planners, merchandisers, and analytics staff examine whether recent residuals remain centered, whether variance is widening, and whether certain categories show early signs of drift. This does not mean the forecast is rebuilt every month. It means NorthStar now treats validation as an ongoing governance process that protects trust before operational failures become obvious. The organization is learning that forecast evolution is not a sign of weakness, but a sign of institutional discipline.
A forecast deserves trust only when its ongoing behavior remains aligned with the decision environment it supports.
Treating a good historical score as proof that the forecast is still safe to rely on now.
This chapter showed how organizations monitor residuals to assess whether a forecast continues to deserve trust. But a broader question emerges: what happens when multiple models, automated systems, and AI-generated forecasts must be considered together?
In Chapter 7, the focus shifts from single-model validation to system-level reasoning. The issue is no longer only whether a forecast is drifting, but how to interpret differences across competing forecasts. Forward validation remains essential, but governance becomes comparative, and system design becomes more explicitly shaped by human–AI collaboration.
In this setting, decision triggers are no longer driven only by statistical best estimates and intervals. Divergence across models, changes in residual behavior, and scenario disagreement become practical signals for action, escalation, and redesign.

