Seeing Structure in Time
Decomposition as a Tool for Interpretation and Communication
When data fluctuate, organizations often react.
When data are structured, organizations begin to understand.
The difference between reaction and understanding is usually not more data. It is a clearer way of organizing what the data are already saying.
In Chapter 2, smoothing helped reduce short-term volatility so that decision-makers could see direction more clearly. That was useful, but it left an important question unresolved: when a time series moves up and down, what kinds of patterns are actually mixed together inside that movement?
This chapter introduces decomposition as a way of seeing structure in time. Its purpose is not to present decomposition as a forecasting contest or as a purely technical procedure. Its purpose is to help readers distinguish what is changing, what is repeating, and what may simply be noise. That distinction matters because organizations rarely struggle only because they lack data. More often, they struggle because they misread the data they already have.
Time-series data often contain several forces at once. A series may reflect a longer-run direction, a recurring seasonal rhythm, and short-term irregular disruptions. When those forces remain blended together, decision-makers may mistake seasonal movement for growth, overreact to temporary fluctuations, or overlook meaningful structural change. Decomposition provides a disciplined way to separate those layers before stronger claims are made.
The chapter therefore treats decomposition first as a tool for interpretation and communication, and only second as an analytical procedure. The goal is decision usefulness. By learning to separate temporal structure into interpretable components, readers strengthen Data Understanding, sharpen Analytical Logic, use AI-Enabled Reasoning more responsibly, and support clearer Decision Design.
This chapter also occupies a specific place in the book’s larger spine: Structure → Behavior → Trust → Decision. Chapter 3 focuses on structure. It helps readers see temporal patterns more clearly so that later chapters can examine how models behave, when forecasts deserve trust, and how forecast systems should guide action.
This chapter follows the Forecast-by-Design reasoning progression:
Observe → Understand → Practice → Reason → Design → Decide → Integrate → Consolidate → Continue
The learning flow unfolds as follows:
This chapter is designed as a continuous reasoning system. Each component prepares the next.
After completing this chapter, you should be able to:
How can organizations separate signal from noise in time-series data so decisions become clearer before they become faster?
When the world shut down in early 2020, so did the hum of hotel lobbies.
At Marriott International, the world’s largest hotel chain, occupancy rates collapsed almost overnight. Within weeks, average occupancy fell from over 80 percent to below 30 percent. Thousands of properties—business hotels, resorts, airport locations—stood nearly empty.
For months, data that once displayed familiar seasonal rhythms—summer surges, winter slowdowns—looked like static. Charts that had long guided planning and staffing decisions no longer made sense. The patterns had not disappeared, but they were buried beneath disruption.
By 2022, guests began returning—but unevenly. Resort destinations rebounded quickly as “revenge travelers” sought leisure escapes. City-center hotels, heavily dependent on business travel, lagged far behind. Even within the same country, recovery varied by region, by city, and sometimes by block.
Inside Marriott’s headquarters, executives faced a simple but urgent question:
How much of our rebound reflects real recovery—and how much is the calendar misleading us?
To answer it, the analytics team assembled several years of occupancy and revenue-per-room data and took a step that was conceptually simple but analytically powerful: they decomposed the time series.
Instead of viewing one volatile curve, they separated the data into three components:
As these components appeared on the screen, the story came into focus.
What had previously appeared chaotic now became interpretable: a fragile but persistent recovery trend, recognizable seasonal rhythms, and increasingly manageable short-term disruptions.
That separation transformed the management conversation.
By mid-2023, Marriott’s financial outcomes reflected this clarity. Leisure-driven markets outperformed expectations, seasonal initiatives were better timed, and assumptions about business travel were grounded in evidence rather than intuition.
Importantly, this insight did not come from new data. It came from a clearer way of organizing existing information.
This case illustrates why decomposition is more than a technical step. It is a design for interpretation and communication. By separating long-term direction, recurring patterns, and irregular shocks, decomposition enables organizations to reason about time—and to respond deliberately rather than react to noise.
To understand how this clarity is achieved, we now turn to decomposition as a structured way of organizing time-series behavior into interpretable components—before introducing forecasting or estimation.
At its core, decomposition is a way of making sense of time-ordered data by separating what appears to be happening all at once.
A raw time-series plot often blends several kinds of movement together. Some movement reflects a slow directional change. Some follows a recurring rhythm. Some is temporary and irregular. When these layers remain combined, the eye sees movement, but the mind may not know what kind of movement it is seeing. This is where many decision errors begin.
Decomposition addresses that problem by asking three disciplined questions:
These questions make decomposition a conceptual tool before it becomes a technical one. Before managers decide whether to expand inventory, revise staffing, or change expectations, they need a structured way to describe what kind of signal they believe they are seeing.
A helpful analogy is music. A song contains melody, rhythm, and background texture at the same time. If all of those blend into one indistinguishable sound, it becomes difficult to follow what the song is doing. Decomposition does for time-series data what separating instruments does for music: it makes structure more visible.
From the larger logic of the book, this section belongs to Structure → Behavior → Trust. Decomposition begins with structure. It does not yet tell us how a forecasting model will behave, and it does not yet establish trust. But without a clear view of structure, later judgments about behavior and trust rest on weak foundations.
Different decisions depend on different parts of the signal. Long-run planning depends more on direction. Operational timing depends more on repeating rhythm. Monitoring depends on recognizing when a sudden movement is likely irregular rather than structural.
Without decomposition, all of these are mixed together.
With decomposition, decision-makers can ask better questions
A common mistake is to treat every visible movement as equally meaningful. A sudden spike attracts attention, but attention is not the same as importance. Another mistake is to assume that smoothing alone creates understanding. Smoothing helps reveal direction, but decomposition helps name the sources of variation.
At NorthStar, misreading the signal may lead to overordering, poor staffing choices, unnecessary promotional changes, or misplaced confidence about demand.
Suppose weekly sales rise sharply before a holiday. Without decomposition, the increase may be described as growth. With decomposition, the better question becomes: is this sustained directional change, expected seasonality, or short-term irregularity?
To use decomposition well, we next need a clear language for its main components.
Most introductory decomposition logic separates a series into three broad components:
These are not new patterns created by the method. They are categories that help analysts organize how change unfolds through time.
Trend: The longer-run direction
Trend captures the slower-moving direction of the series. It reflects whether the overall level is rising, falling, or remaining broadly stable over time.
Trend matters because it supports medium- and long-term planning. A rising trend may justify expansion, larger procurement commitments, or strategic optimism. A declining trend may signal deeper issues that cannot be solved through short-term interventions alone.
Seasonality: The recurring rhythm
Seasonality captures patterns that repeat over a known calendar cycle. Depending on the context, these may be weekly, monthly, quarterly, or annual.
Seasonality matters because it helps managers distinguish expected variation from meaningful change. Seasonal structure supports timing decisions such as staffing, inventory, promotions, and logistics.
Irregular variation: The residual shocks and noise
Irregular variation captures what remains after trend and seasonality are considered. It includes random fluctuation, short-term disturbances, temporary shocks, and other deviations that do not fit the broader structure.
This component is important precisely because it is easy to misread. It often looks dramatic, but it is not always decision-worthy.
At a descriptive level, an observed series can be written as:
where Tₜ represents trend, Sₜ seasonality, and I ₜ irregular variation. At this stage, the notation is conceptual. It identifies layers of variation without yet committing to a particular estimation method.
Different components support different decision horizons:
This distinction strengthens the chapter’s central purpose: decomposition helps determine which changes should drive action and which should not.
Three common mistakes appear repeatedly:
This is where the first anchor matters: Structure → Behavior → Trust. If structure is misread here, later judgments about behavior and trust become weaker.
Once the components are identified, the next question is how they combine.
After identifying trend, seasonality, and irregular variation, the next question is structural: how do these components combine to produce the observed series?
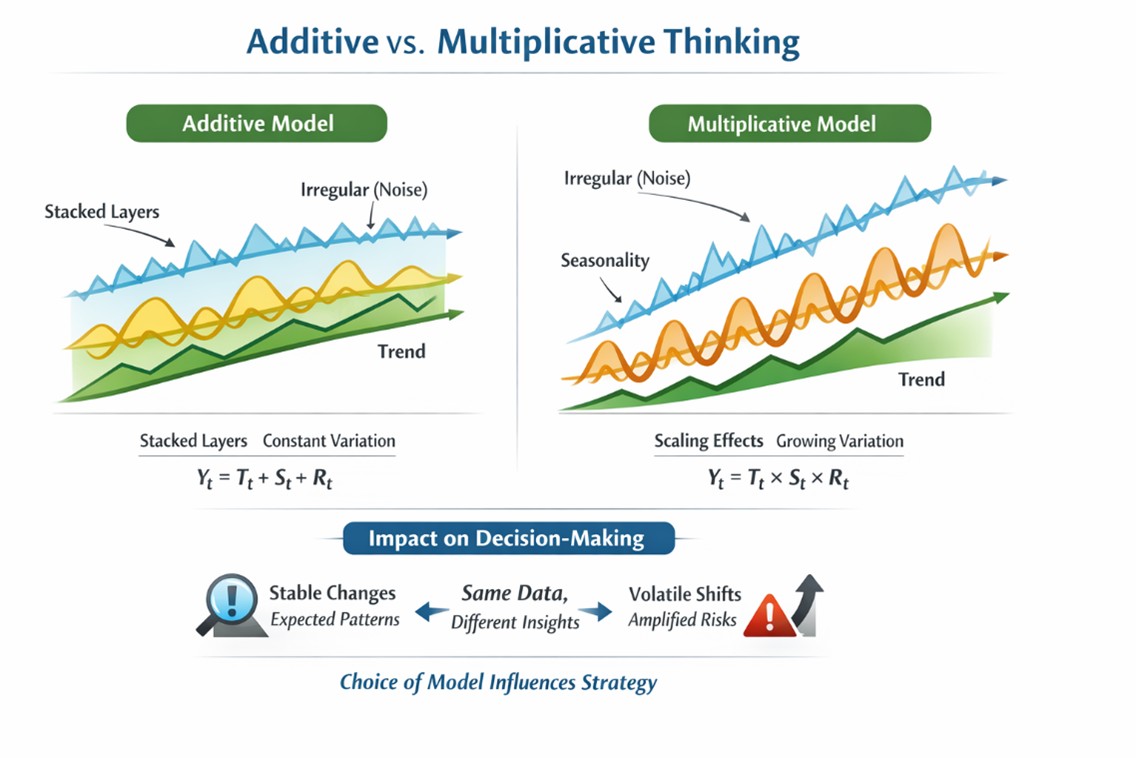
Two common conceptual forms are additive and multiplicative.
In an additive view, the components stack together:
Yₜ = Tₜ + Sₜ + Rₜ
This form is useful when seasonal effects and irregular variation remain roughly stable in absolute size as the level of the series changes.
In a multiplicative view, the components scale with the level of the series:
Yₜ = Tₜ × Sₜ × Rₜ
This form is useful when variation behaves proportionally rather than absolutely. A given seasonal effect becomes numerically larger when the overall level of the series is higher.
The choice between additive and multiplicative structures is not just technical—it directly affects how decision-makers interpret variation.
A pattern that appears unusually large under an additive view may be entirely expected under a multiplicative view. This is because:
As a result, the same data can support different conclusions depending on how variation is framed.
Design Implication:
Choose the structure that matches the decision context.
Analogy:
Interpreting structure is like choosing a camera lens. A standard lens preserves scale, while a wide-angle lens emphasizes proportional differences. Both show the same scene—but guide attention differently.
This contrast is useful:
That comparison helps students see that the distinction is not just mathematical. It is interpretive.
Suppose NorthStar’s holiday sales lift is roughly 800 extra units each year. Additive thinking may fit well. But if holiday sales are typically 12% above the current level, multiplicative thinking may be more meaningful.
The structural lens affects how managers interpret risk, how analysts explain expected movement, and how the organization decides whether a change is normal or surprising.
Several misinterpretations are common:
The appropriate structural form should support communication and decision usefulness, not just technical neatness.
Once the structure is separated and represented clearly, decomposition becomes more than analysis. It becomes a communication system.
In practice, decomposition is valuable not only because it separates a series into components, but because it gives organizations a shared language for discussing what they see.
Different stakeholders often look at the same time-series plot and tell different stories. A store manager may focus on the latest dip. A finance leader may focus on the broader direction. A marketing manager may point to seasonal campaigns. None of them is necessarily being unreasonable. They are simply attending to different layers of a blended signal.
Decomposition makes those layers explicit:
That separation improves discussion. Instead of arguing vaguely about whether the data are “good” or “bad,” teams can ask which component is driving the current movement and whether that component deserves action.
Executives rarely need every technical detail. They need structured clarity about direction, rhythm, and uncertainty. Decomposition supports that clarity. It does not remove uncertainty, but it makes uncertainty easier to understand and discuss.
At NorthStar, poor communication around temporal structure can lead to inventory mistakes, poor promotional timing, staffing mismatches, and inconsistent decisions across roles.
A common mistake is to present decomposed charts without explaining what they mean for action. Another is to rely on technical language that hides rather than clarifies meaning.
This is where the second anchor becomes important: Models don’t decide—systems do. A decomposition chart becomes valuable only when it is embedded in a system of interpretation, communication, and action.
The next step is to move from conceptual understanding to structured practice.
A Basic Decomposition Workflow for Better Decisions
This SkillBox develops a first hands-on decomposition workflow. The goal is not coding complexity. The goal is to practice separating a time series into interpretable components and translating those components into business meaning.
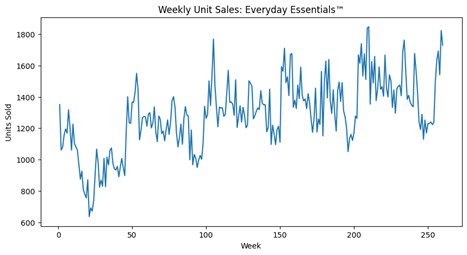
At NorthStar RetailGroup, category managers reviewing weekly unit sales for Everyday Essentials need to know whether observed movement reflects genuine change, normal seasonal rhythm, or short-term irregularity. Without that distinction, the same chart can trigger inconsistent actions across managers.
Primary dataset: essentials_sales_lite.csv
NorthStar uses weekly sales signals to guide inventory timing, staffing expectations, and promotional planning. If the decomposition is misread, managers may overreact to noise, confuse seasonal peaks with growth, or miss a meaningful shift in demand.
You will:
Python
import pandas as pd
import matplotlib.pyplot as plt
from statsmodels.tsa.seasonal import seasonal_decompose
df = pd.read_csv("essentials_sales_lite.csv")
sales.plot(figsize=(10,4), title="NorthStar Everyday Essentials - Weekly Unit Sales")
plt.ylabel("Units Sold")
plt.show()
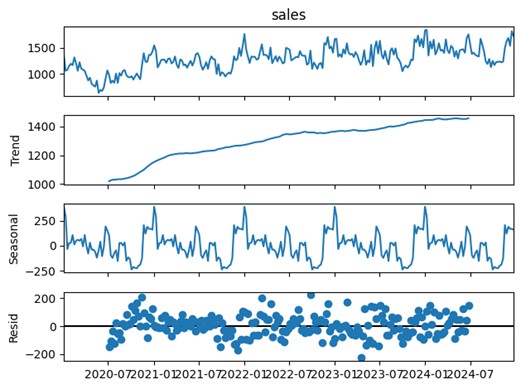
result = seasonal_decompose(sales, model="additive", period=52)
result.plot()
plt.show()
decomp_df = pd.DataFrame({
"observed": result.observed,
"trend": result.trend,
"seasonal": result.seasonal,
"irregular": result.resid
})
print(decomp_df.head())
R
library(readr)
library(ggplot2)

df <- read_csv("essentials_sales_lite.csv")

sales_ts <- ts(df$units_sold, frequency = 52)

autoplot(sales_ts) +
  ggtitle("NorthStar Everyday Essentials - Weekly Unit Sales") +
  ylab("Units Sold") + xlab("Week")

decomp <- decompose(sales_ts, type = "additive")

autoplot(decomp)

head(data.frame(
  observed = decomp$x,
  trend = decomp$trend,
  seasonal = decomp$seasonal,
  irregular = decomp$random
))Your outputs should include:
            observed  trend    seasonal  irregular
week
2020-01-05    1351.0    NaN  392.274547        NaN
2020-01-12    1061.0    NaN  293.519739        NaN
2020-01-19    1079.0    NaN  -32.622088        NaN
2020-01-26    1156.0    NaN   28.038970        NaN
2020-02-02    1195.0    NaN   29.933201        NaN
Use the decomposition to answer questions such as:
Errors in this workflow usually appear as misinterpretation, not only coding mistakes:
A common pitfall is assuming that software output is the conclusion. It is not. The output is a structured representation that still requires judgment.
The most useful decomposition is not the most technical one. It is the one that helps the organization distinguish what should guide strategy, what should guide timing, and what should merely be monitored.
In 4–6 sentences, explain:
You have now practiced basic decomposition. The next step is to reason about it more critically, especially when AI explanations sound fluent but do not fit the decision context.
From Decomposition Output to Decision-Ready Explanation
This LearningLab reinforces the central idea of Chapter 3:
decomposition is not primarily a technical procedure—it is a structured way of interpreting and communicating time.
Using AI as both a learning partner and a thinking partner, this LearningLab helps you move from separating components to reasoning about what those components mean—and what they do not mean—for decisions.
The objective is to:
This LearningLab reinforces:
At this stage, AI is not used to produce decomposition. It is used to challenge interpretation and improve clarity of reasoning.
In the preceding SkillBox, you decomposed the NorthStar weekly sales series into:
This separation makes patterns visible—but visibility alone does not guarantee correct interpretation.
The key challenge now is:
When a pattern appears clear, how do we know whether it is meaningful?
This LearningLab develops that discipline by using AI to:
Important principle:
Decomposition separates signals.
Judgment determines which signals matter.
NorthStar analysts now have a decomposition view of weekly sales. The raw series has been separated into interpretable components.
However, new risks emerge:
Different managers may interpret the same decomposition differently.
This creates a critical need:
A shared, disciplined way to explain what the data mean before acting on them.
To support this, analysts use AI not to generate conclusions, but to:
You will engage with AI in three structured modes:
Reinforce → Extend → Explore
Work through them in order.
Stabilize your understanding of decomposition as a way of organizing time-series structure.
“Key Concepts from Chapter 3
“I understand the components and can explain what each represents in business terms.”
Develop the ability to evaluate competing interpretations of the same decomposition.
Optionally explore additional analytical concepts or methods that interest you but not covered in the chapter.
“I can critically evaluate decomposition outputs and avoid common interpretation errors.”
Connect decomposition to managerial decisions and organizational communication.
At this stage, the goal is not more analysis—but clearer explanation and better judgment.
“I understand how decomposition supports decisions and improves communication under uncertainty.”
After completing all three modes:
The goal is to evaluate reasoning—not outsource it.
Prepare a structured response including:
Explain trend, seasonality, and irregular variation in clear business language for a NorthStar manager.
Should a manager act immediately on a short-term spike in sales?
Justify your answer using decomposition logic.
You must:
Principle:
AI expands analytical range, but does not replace analytical responsibility.
Decomposition does not create new information. It reorganizes existing variation into interpretable structure.
This supports three types of reasoning:
AI can:
But it cannot:
Insight:
Better decisions begin not with better models, but with better interpretation of structure.
You have now moved from:
separating structure → interpreting structure
The next step is:
interpreting structure → designing how it is used
How should decomposition be embedded into:
The DesignStudio will move from:
interpretation → system design → decision alignment
From Decomposition Insight to Better Managerial Action
This DesignStudio asks you to move beyond analysis and design how decomposition should be used inside an organization. The focus is not on building another model. The focus is on building a decision-support system.
At NorthStar RetailGroup, weekly category reports are distributed to store managers, regional planners, and supply-chain coordinators. Most reports still emphasize raw sales movement. The result is predictable: short-term spikes trigger reaction, seasonal peaks are confused with growth, and longer-run trend is often underused.
Leadership wants a redesign. They want a reporting and interpretation process that makes trend, seasonality, and irregular variation easier to understand and easier to use.
How should NorthStar design its reporting and interpretation system so managers focus on the right signals, avoid overreaction, and make more consistent decisions across roles?
You may use:
Prepare a 1-page design brief that addresses the following:
What should managers see each week?
Decide whether the report should include:
What questions should managers be trained to ask when reviewing the report?
Specify which signals should support:
How will your design reduce the risk of:
How will store, regional, and supply-chain managers use the same report in aligned rather than contradictory ways?
Submit a 1-page Design Brief including:
Your work will be evaluated on:
Decomposition becomes valuable when it changes organizational attention. Well-designed systems do not simply show data. They shape what people notice, how they interpret it, and when they act.
You have now practiced decomposition, reasoned with AI, and designed a decision-support structure. The next step is to transfer this logic into a new context.
Using Decomposition to Support Decision Conversations
A regional grocery retailer is reviewing weekly sales for a staple household category. Over the past year, the series has shown several visible rises and dips. Some managers believe customer demand has become unstable. Others believe most of the movement reflects normal seasonal behavior combined with short-term noise.
To support the conversation, the analytics team prepares a decomposition view separating the series into trend, seasonality, and irregular variation. No forecast model has yet been built.
The leadership team must decide whether recent changes justify immediate operational action, such as reallocating inventory or changing staffing levels, or whether those changes should be treated cautiously until the signal becomes clearer.
The team has:
Write a short decision memo addressing the following:
Prepare a concise memo of about 250–350 words in business language. No coding is required.
How does decomposition change the quality of the conversation among decision-makers? Which disagreements does it help resolve, and which may still remain?
A useful decomposition does not eliminate uncertainty. It helps leaders decide which uncertainty deserves action, which deserves monitoring, and which should not dominate the conversation.
Decomposition helps organizations see that a time series is not one signal but several signals layered together. By separating trend, seasonality, and irregular variation, analysts improve interpretation before they improve prediction. The real value of decomposition is not only analytical clarity but decision clarity.
At NorthStar RetailGroup, Chapter 3 adds the first formal structural lens to the weekly sales decision system. Managers now have a shared language for distinguishing directional movement, recurring rhythm, and short-term irregularity rather than reacting to the raw series alone. This improves alignment across category planning, operations, and supply-chain coordination. NorthStar’s forecasting system is still developing, but the organization is already moving from undifferentiated reaction toward structured judgment. That shift prepares the next stage: learning how visible temporal structure can be modeled more deliberately.
In every response:
Q1. In your own words, explain what decomposition is and what it is not. Why can it improve business judgment even before a forecast is produced?
Q2. Define trend, seasonality, and irregular variation in plain language. Why is each useful for a different managerial question?
Q3. A manager sees a strong increase in the latest two weeks and claims demand is clearly growing. Using decomposition logic, explain why that conclusion may be too quick.
Q4. Why can seasonality create false confidence or false alarm if it is not recognized? Give one example of a decision that could go wrong because of this mistake.
Q5. Suppose an AI tool explains a sales spike by saying, “This indicates business momentum is improving.” What follow-up questions should you ask before accepting that explanation?
Q6. Write a 4–5 sentence manager-facing explanation of decomposition that an AI tool might generate. Then identify one weakness in that explanation and improve it.
Q7. How does decomposition extend the logic of smoothing from Chapter 2? What does decomposition reveal that smoothing alone does not?
Q8. “Models don’t decide—systems do.” Use this phrase to explain why a decomposition chart by itself is not enough to improve organizational decisions.
Managers should not treat every visible change as equally meaningful. Better decisions come from identifying which component is moving and whether that component should actually trigger action.
A common mistake is to confuse seasonal peaks or short-term irregular spikes with true growth.
Decomposition helps us see structure, but it does not yet tell us how to estimate visible temporal structure in a disciplined forecasting workflow or how to choose among competing representations when trend and seasonality interact more directly. Chapter 3 improves interpretation, but it does not fully operationalize modeling. Chapter 4 takes that next step by moving from seeing visible structure to estimating and using it more deliberately.

