The Logic of Time and Decision
Why Forecasting Is a Design Problem, Not a Modeling Task
A company can have abundant data, skilled analysts, and sophisticated models—and still make poor decisions.
Why? Because forecasting is often treated as a contest to produce the “right number,” when its real purpose is to help people act responsibly under uncertainty. In practice, managers do not need forecasts merely to know what might happen. They need forecasts to decide what to do before the future becomes visible.
This chapter begins with a simple but powerful shift in perspective: forecasting is not primarily a modeling task; it is a design problem. The central challenge is not only how to estimate the future, but how to design a system that helps organizations interpret change, manage uncertainty, and make better decisions over time.
Organizations constantly make decisions whose consequences unfold over time. Retailers decide how much inventory to stock before demand is known. Energy companies plan production months before prices change. Governments commit budgets long before tax revenues are realized.
These decisions cannot wait for certainty. They depend on structured expectations about what may happen next.
Forecasting provides that structure. At its core, forecasting is not merely about predicting numbers. It is about supporting decisions when the future is uncertain and the cost of waiting is high. This is why the central logic of this book is straightforward: forecasting is a decision-support system, not a prediction contest.
Forecasting is often taught as a technical exercise. Students learn how to fit models, compare methods, and calculate accuracy measures. Those skills matter, but they capture only part of the forecasting process. In real organizations, forecasts are used to coordinate action across time—to plan inventory, allocate resources, manage risk, and respond to change. A forecast is therefore not just a number. It is a structured signal that informs judgment.
This chapter introduces forecasting from that broader perspective. Rather than beginning with estimation methods, we begin with the logic that makes forecasting necessary in the first place: how time shapes decisions, how forecasting differs from prediction, how modern analytics expands forecasting capability, and how patterns in time-ordered data help organizations act more intelligently.
Throughout the chapter, one foundational idea will guide us: Structure → Behavior → Trust → Decision. In Chapter 1, the emphasis is introductory and conceptual. We begin learning to see structure in time so that later chapters can examine how forecasts behave, how trust is established, and how decisions are designed responsibly.
This chapter follows the book’s required learning progression, referred to in later chapters as the Forecast-by-Design reasoning progression:
Observe → Understand → Practice → Reason → Design → Decide → Integrate → Consolidate → Continue
The learning flow unfolds as follows:
This chapter establishes the conceptual foundation and chapter structural framework for the entire book. Each component builds on the previous one, positioning forecasting as a structured, decision-oriented discipline rather than a purely technical task.
Effective forecasting requires integrating data understanding, analytical logic, AI-enabled reasoning, and decision design into a unified system for action. Each chapter emphasizes and integrates them differently, reflecting their evolving roles in effective decision-making.
In this chapter:
Together, these four pillars provide the conceptual architecture for the book. They are not isolated topics, but complementary capabilities that must work together whenever organizations use forecasts to support action.
After completing this chapter, you should be able to:
How should organizations use information from the past to make responsible decisions about an uncertain future?
This question anchors the chapter. It is broader than asking which model is best. It asks how forecasting should be framed, interpreted, and used when uncertainty is unavoidable and decisions cannot be postponed.
In 2008, crude oil prices approached $140 per barrel, a historic high that shaped expectations across industries. By 2014, prices had climbed above $110 per barrel again, reinforcing the belief that high oil prices were not only desirable, but durable. Energy companies expanded production, governments built budgets around sustained revenues, and long-range plans often assumed that recent history would continue.
That sense of stability was reassuring—and deeply misleading.
Within two years, global crude oil prices fell below $30 per barrel. The collapse created fiscal stress for oil-exporting countries, disrupted investment plans, and forced companies to rethink projects that had once looked economically sound. Forecasts that seemed credible under stable conditions suddenly looked fragile.
What failed was not simply the mathematics. In many cases, the deeper problem was design.
Many forecasting systems were tightly anchored to historical patterns that had recently looked stable. Those systems worked reasonably well while the market behaved in familiar ways. But they were less prepared for structural change: rapid growth in U.S. shale production, shifting global supply conditions, weaker demand growth, and changing geopolitical assumptions. The models were disciplined, but the decision systems surrounding them were not adaptive enough.
Some organizations approached the future differently. Companies such as Shell had long used scenario-based planning to explore multiple plausible futures rather than commit to one expected path. That approach did not guarantee a precise forecast of the downturn. But it helped decision-makers prepare for a wider range of outcomes and respond more deliberately when market conditions changed.
The contrast is important. One approach treated forecasting as an attempt to extend the past. The other treated forecasting as a way to prepare for uncertainty.
That distinction captures the central logic of this book. Forecasting succeeds not only when it estimates well, but when it helps people adapt responsibly as conditions evolve. A forecast is useful not because it perfectly predicts the future, but because it helps an organization act intelligently when the future turns out to be different from expected.
This is the first lesson of forecasting by design: the goal is not merely to guess correctly. The goal is to build a system that supports better decisions when time, uncertainty, and change interact.
Forecasting matters because decisions unfold through time and must often be made before outcomes are known.
Organizations rarely make one isolated choice. They act through sequences of decisions: invest or delay, hire or pause, replenish or conserve, expand or retrench. Each decision depends on expectations about what may happen next. That is why forecasting is not optional in modern organizations. Even when people say they are “going with instinct,” they are still acting on an informal forecast.
Forecasting therefore should not be understood only as a technical exercise. It is a disciplined way to design action under uncertainty. Forecasts connect past observations to future decisions—not by eliminating uncertainty, but by helping decision-makers manage it more explicitly.
In business, forecasting shapes decisions such as inventory planning, staffing, pricing, promotions, and capital investment. In public policy, it informs budgets, infrastructure planning, public health preparedness, and energy strategy. Across these settings, the central question is not simply, What will happen? A more useful question is: How should we act, given that the future is uncertain?
This is where the chapter’s core mental model begins to matter. Structure → Behavior → Trust → Decision is not just a slogan. It explains why forecasting must begin with careful interpretation rather than immediate action. If analysts misunderstand the structure in the data, they will misunderstand how forecasts behave. If they do not understand behavior, they cannot justify trust. And without trust, forecast-informed decisions become fragile.
NorthStar RetailGroup operates a regional network of stores selling everyday household essentials. Demand is stable in the long run, but it fluctuates week to week because of promotions, seasonality, and local buying patterns.
At the start of each quarter, NorthStar’s operations team must decide how much inventory to commit to distribution centers. If the company orders too much, it ties up capital and increases storage costs. If it orders too little, it risks stockouts and lost sales.
NorthStar can generate forecasts quickly. But leadership recognizes that producing a forecast is not the same as designing a good decision process. If the system reacts too quickly to short-term noise, inventory plans may become unstable. If it reacts too slowly, managers may miss real shifts in demand.
That is the design challenge of forecasting. The goal is not merely to produce next week’s number. The goal is to design a process that helps managers respond appropriately over time.
A common early mistake is assuming that forecasting matters only when high precision is possible. In practice, even imperfect forecasts can be valuable if they improve timing, coordination, and preparedness. Another mistake is assuming that uncertainty makes forecasting less useful. The opposite is usually true: the more uncertainty matters, the more important it becomes to reason about it explicitly.
For NorthStar, poor forecasting design can lead to unstable replenishment, wasted inventory, service failures, and confused managerial responses. The forecast is not valuable by itself. It becomes valuable only when it improves the quality of action.
If forecasting is more than prediction, we next need to clarify what makes it different.
Forecasting and prediction are closely related, but they are not identical.
Both use data to estimate unknown outcomes. The difference lies in how time is treated and how the result supports decisions.
Forecasting is explicitly structured through time. It asks how a quantity is expected to evolve from the present into a future period. Examples include next month’s energy demand, next quarter’s sales, or next year’s unemployment rate. Forecasting always contains a built-in temporal reference: what is expected to happen later, based on information available now.
Conceptually, we can write a forecast as:
where:
That notation highlights an important feature: forecasting connects what is known at one point in time to what may happen at another. It therefore addresses two linked questions at once: What is likely to happen? and When is it likely to happen?
Prediction, by contrast, is the broader task of estimating an unknown outcome under a set of observed conditions. It is often written more generally as:
where x represents observed features or conditions. Examples include customer churn, insurance claims, fraud detection, or image classification. Here the central question is not necessarily temporal. It is conditional: Given these conditions, what outcome is most likely?
This distinction matters because it affects both modeling logic and interpretation. Forecasting must account for temporal evolution. Prediction may not.
A useful way to remember the difference is this:
Forecasting is therefore not just “prediction later.” It is prediction organized by time and linked more directly to planning, coordination, and adaptation.
In practice, forecasting and prediction often overlap. Forecasting increasingly uses predictive tools, including machine learning, to capture complex patterns. Predictive systems may also benefit from a forecasting perspective when relationships evolve over time.
Still, forecasting remains the organizing lens of this book because it is more naturally aligned with decision-making under uncertainty. Forecasting is not only about estimating an unknown value. It is about reasoning forward through time.
A common mistake is to treat any model that produces a future number as a forecasting system. But a forecasting system must do more than output a value. It must specify horizon, timing, update logic, interpretation, and how decisions should respond when conditions change.
This is why models don’t decide—systems do. A model may generate a forecast. A system determines how that forecast is understood, challenged, communicated, and used.
If forecasting is a broader decision-support process, what capabilities are needed to do it well? The book answers that question through four recurring analytical pillars.
This book organizes forecasting around four recurring capabilities:
These pillars are not rigid steps and they are not isolated silos. They form a connected framework for thinking about modern forecasting in an age of AI.
Data Understanding concerns how time-ordered evidence is generated, structured, visualized, and interpreted. Before analysts can build models, they must learn to read the data: what is measured, how often, in what order, and with what limitations.
Analytical Logic concerns disciplined reasoning about structure, assumptions, uncertainty, and model behavior. It helps analysts distinguish pattern from noise and interpret results coherently.
AI-Enabled Reasoning extends analytical capability through pattern discovery, scenario exploration, and structured interaction with intelligent systems. In this book, AI is treated as a reasoning partner, not a substitute for judgment.
Decision Design connects forecasts to action. It asks how forecasts are framed, communicated, governed, and embedded into real organizational choices.
These pillars will reappear throughout the book, but this chapter introduces them conceptually rather than operationally. The goal is orientation. You are not expected to master all four at once. You are expected to recognize that robust forecasting requires all four.
Seen through the chapter’s global spine:
That is why the pillars matter. They help you place each future method inside a broader system of reasoning.
At NorthStar, sales data must first be understood visually and contextually. Analysts then reason about patterns and uncertainty. AI may help them explore hypotheses or detect emerging signals. Managers still must decide how forecast outputs should influence inventory commitments.
All four pillars are present, even in a simple retail example.
A common mistake is to treat forecasting as belonging only to Analytical Logic—as if modeling were the whole task. In reality, a technically sound model can still fail if the data are misunderstood, AI outputs are used uncritically, or the decision process is poorly designed.
The four pillars are not academic categories. They are practical capabilities that keep forecasting connected to organizational action.
To understand how modern forecasting operates in the age of AI, we next distinguish two broader learning philosophies: statistical learning and machine learning.
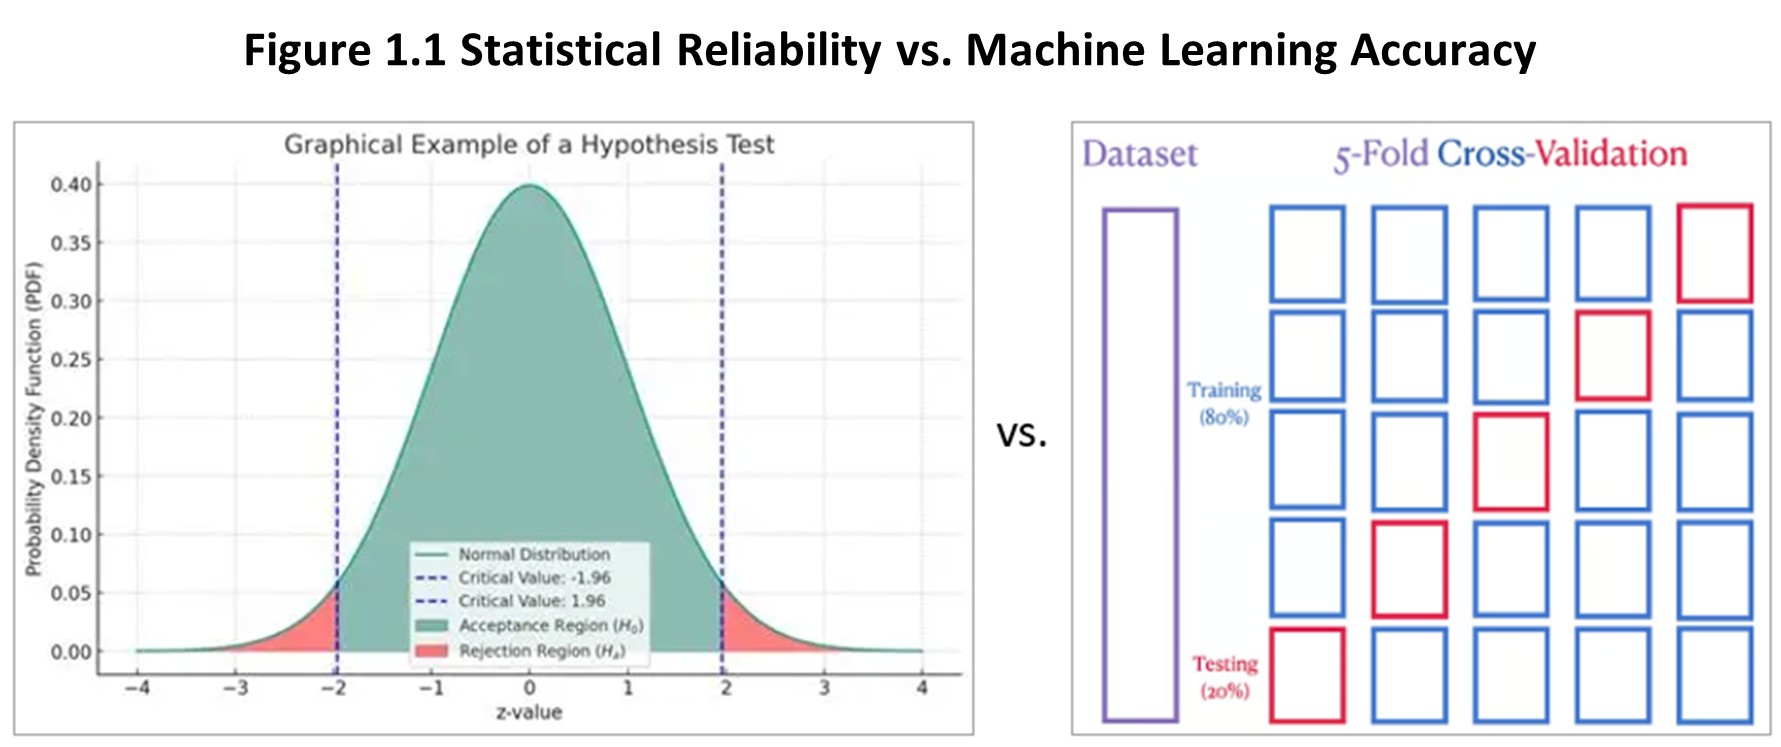
Today, statistical learning and machine learning represent two complementary approaches to learning from data.
Statistical learning focuses on drawing inference from sample data to generalize to a broader, unobserved population. It emphasizes interpretability, structural understanding, and the quantification of uncertainty.
Machine learning likewise learns from data, but focuses on training algorithms to capture patterns within and generalize beyond the training environment, often prioritizing generalization performance and flexibility rather than interpretability and uncertainty.
In practice, the two approaches rely on overlapping tools. Both may use regression, optimization, and computational techniques. Both aim to discover patterns in data.
For forecasting, however, the most meaningful distinction is not the algorithm itself—it is how each approach builds trust in its results, and more specifically, whether that trust is grounded in inferred reliability or confirmed accuracy.
Two Different Foundations of Trust
Statistical learning builds trust through reasoning about probabilistic reliability under uncertainty.
Its foundation lies in pre-assumed probability distributions, sampling variability, and inference. The central question is:
Given what we observe (a sample) and what we do not observe (the population), how confident should we be in our conclusions?
From a Forecast-by-Design perspective, statistical learning focuses on whether a forecast remains trustworthy as conditions evolve. It emphasizes:
This makes it especially valuable when decisions require interpretability, accountability, and forward-looking judgment.
Machine learning, in contrast, builds trust through accuracy on observable data.
It trains algorithms to detect patterns embedded in available data and evaluates them based on validation performance. The central question is:
How well does this model perform when applied to data not included for training?
From this perspective, trust is earned through:
Machine learning is especially powerful when:
The difference is not that one approach is “traditional” and the other “advanced.”
A more meaningful distinction is:
Both approaches address uncertainty—but they justify trust in different ways :
This distinction is central to forecasting by design.
You can think of:
In practice, effective forecasting combines both:
we verify performance empirically while also reasoning about whether that performance will hold.
Forecasting is not only about predictive performance. It also involves:
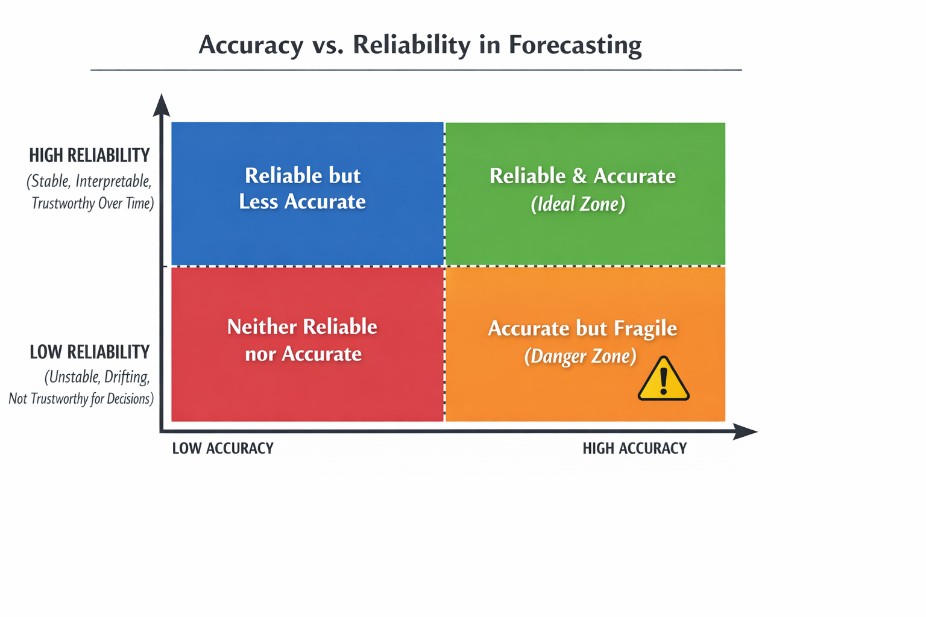
A model that is highly accurate today may still fail tomorrow if its assumptions no longer hold. This is why accuracy alone is not sufficient for decision-making.
Because accuracy and reliability do not go together, the key question in practice is not which approach is superior, but:
Which form of trust—accuracy or reliability—best fits the decision environment?
For example:
Think of two ways to justify a business decision:
Both build trust—but through different lenses:
one through reliability, the other through accuracy.
A common mistake is assuming that better test performance automatically leads to better decisions.
However, a highly accurate model may still be:
In these cases, accuracy does not translate into trust.
Forecast quality is not only a property of the algorithm.
It is also a property of how trust is established—and whether that trust matches the decision setting.
In Forecast by Design terms:
Models don’t decide—systems do.
Learning philosophies differ not only in how they validate models, but also in the types of data they rely on. We next turn to the distinction between structured and unstructured data, and how each shapes what can be learned—and trusted—in forecasting systems.
Modern forecasting systems increasingly work with two broad forms of evidence: structured data and unstructured data.
Structured data are organized into clearly defined rows (or records) and columns (or variables). Examples include sales records, inventory levels, transactions, survey responses, and sensor readings. Because variables are predefined and observations are comparable, structured data support clear measurement, explicit assumptions, replication, and auditing.
This makes structured data especially compatible with disciplined forecasting practice. When analysts work with structured data, they can ask questions such as: What is changing? How stable is the pattern? How uncertain is the estimate? These are questions closely aligned with Data Understanding and Analytical Logic.
Unstructured data, by contrast, do not arrive in neat relational format. They include text, images, audio, video, reviews, call transcripts, emails, and news reports. These sources often contain rich signals about sentiment, behavior, context, and emerging change—but those signals are not immediately measurable in the same way as a spreadsheet column.
Recent advances in AI and machine learning have made it possible to learn from unstructured data much more directly. AI can extract themes from text, detect sentiment in reviews, identify objects in images, and surface patterns across large collections of documents. In other words, AI can help transform contextual evidence into usable signals.
This distinction matters because different forms of evidence support different types of trust.
Both are useful. The design question is not which type is superior. The better question is: What kind of evidence does this decision require—precision, context, or both?
NorthStar’s weekly sales history is structured data. It helps analysts measure trend, seasonality, and variation in a disciplined way. But customer reviews, supplier messages, and local social-media chatter may reveal emerging changes in preferences or disruptions before those changes fully appear in sales records.
Together, the two forms of evidence can improve judgment.
A common mistake is assuming that more data automatically means better decisions. But additional data only help when analysts understand what kind of evidence they are using and what role that evidence should play.
Another mistake is treating unstructured AI-generated insight as equally reliable in all settings. Rich contextual signals can be valuable, but they still require interpretation, validation, and governance.
If NorthStar relies only on structured sales history, it may miss early warning signals. If it relies too heavily on noisy contextual information, it may overreact. Good design requires balance.
Once we understand that forecasting may draw on broader evidence, we can see more clearly how AI expands forecasting design.
For much of its history, forecasting focused on producing a single best estimate of the future, often with an interval expressing uncertainty. That remains useful. But in many modern environments, a single point estimate or a confidence interval is not enough to guide action well.
Why? Because organizations do not only need estimates. They need ways to prepare, adapt, and revise as conditions change.
This is where AI expands forecasting design.
AI makes it easier to explore multiple plausible futures, stress-test assumptions, incorporate unstructured signals, simulate alternative scenarios, and update systems more dynamically as new information arrives. That does not mean AI replaces forecasting logic. It means AI broadens the range of questions forecasting can support.
Traditional forecasting often emphasizes:
AI-enhanced forecasting makes room for additional questions:
This is an important shift. Forecasting becomes not only retrospective extrapolation, but also prospective design.
AI most directly expands the Behavior and Trust portions of the forecasting spine. It helps analysts explore how systems may behave under different assumptions and detect a wider range of signals. But AI does not create trust automatically. Trust still depends on disciplined reasoning, validation, and human oversight.
This is why the book’s AI rule is so important: AI supports reasoning. Humans own decisions.
NorthStar might use traditional time-series data to estimate expected weekly demand. But AI could also help summarize customer feedback, identify unusual shifts in product attention, or generate alternative demand scenarios under changing promotional conditions.
Used well, this expands managerial awareness. Used poorly, it can amplify noise and overconfidence.
A common mistake is thinking AI makes forecasting automatically smarter. In reality, AI can just as easily make poor reasoning faster. Without Data Understanding, Analytical Logic, and Decision Design, AI may produce outputs that look impressive but are not decision-ready.
AI becomes valuable when it helps organizations prepare across a range of plausible futures rather than cling too tightly to a single predicted one.
To use forecasting responsibly, we still need a basic language for seeing structure in time itself. We now turn to trend, seasonality, and noise.
At its core, forecasting treats time as data.
Observations in a time series are not isolated snapshots. They are part of an ordered sequence. What happened earlier often affects what we expect later. That is why time-ordered data require a different kind of reasoning from ordinary cross-sectional data.
In this book, we work with time series such as daily prices, weekly sales, monthly claims, or quarterly revenue. What defines them is not the variable itself, but the fact that observations are recorded through time in sequence.
To interpret how a time series behaves, analysts often begin with three broad components:
Conceptually, the observed series can be understood as a combination of these sources of variation.
At this stage, the notation is descriptive rather than technical. The purpose is to help you learn to see temporal structure before you learn formal estimation methods.
Trend represents long-run movement. A sales series may grow gradually over time, decline steadily, or remain broadly flat. Trend helps managers think about structural direction. Is demand fundamentally rising? Is the market gradually weakening? Is the business changing in a durable way?
Seasonality represents repeating cycles associated with the calendar or routine patterns in behavior. Retail sales may spike during holidays. Electricity demand may increase in summer. Store traffic may rise on weekends.
Seasonality matters because many operational decisions depend on timing. A business may not need more total inventory over the year, but it may need more inventory at the right moments.
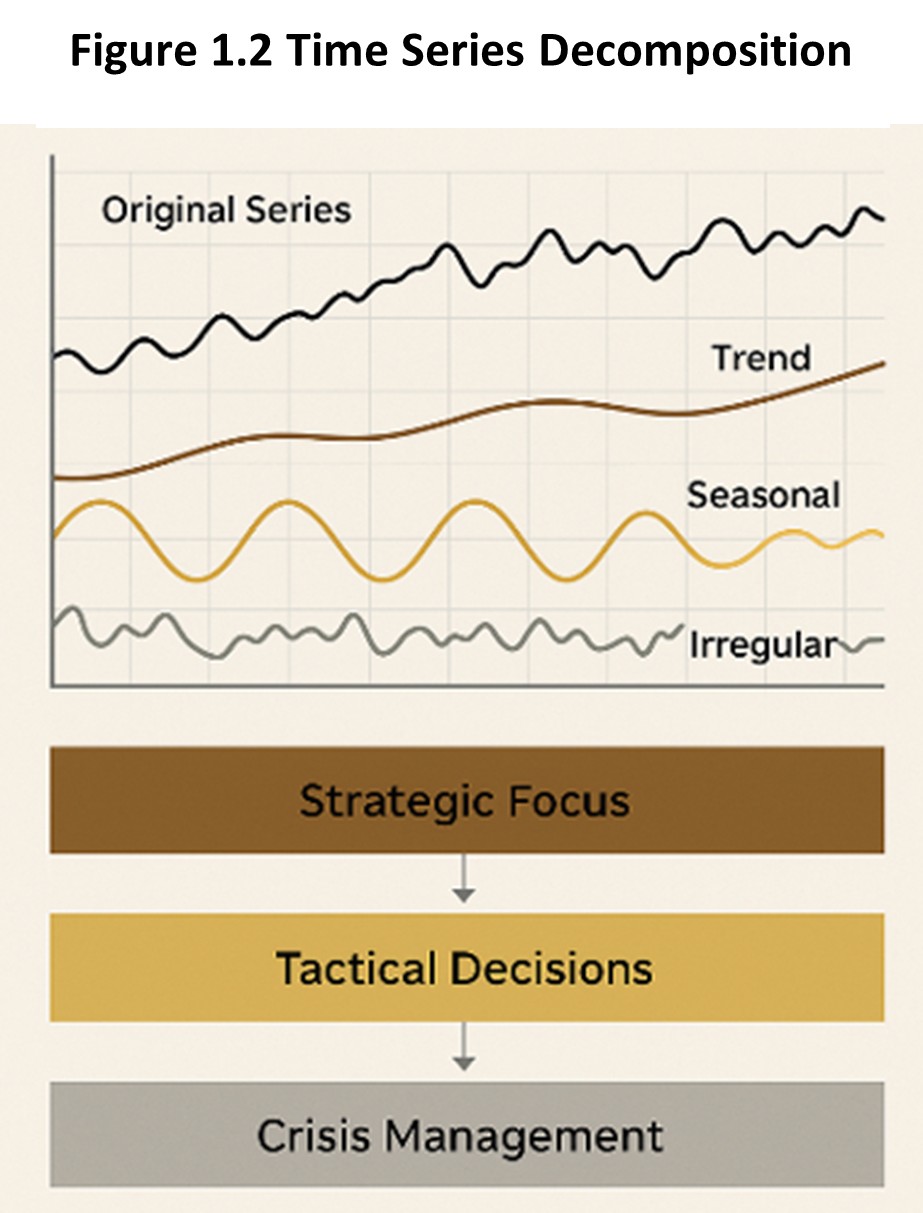
Noise captures short-term irregular movement. It may reflect weather, promotions, temporary disruptions, unusual one-time events, or ordinary randomness. Noise reminds us that no forecast can eliminate uncertainty completely.
These components matter because each shapes decisions in a different way:
Ignoring any one of these components can lead to poor decisions.
Ignoring trend may overlook structural change. Ignoring seasonality may lead to mistimed actions. Ignoring noise may create false confidence.
Even when all components are recognized, misaligning them with decision needs can still lead to flawed choices—for example, overreacting to short-term noise in long-term planning, or relying on long-term trends for short-term operational timing.
This is one of the first places where the chapter’s core anchor becomes practical: Structure → Behavior → Trust. Before any method can be judged, analysts must first see what kind of structure may exist in the data.
A common mistake is to react to every movement as though it reflects meaningful change. Another is to assume that visible structure is permanent. In reality, trends can reverse, seasonality can shift, and noise can intensify during disruption.
For NorthStar, failing to distinguish trend, seasonality, and noise could lead to inventory instability, poor staffing, or mistaken interpretation of demand shifts.
Before analysts formalize structure with models, they must first learn to observe it. That is the purpose of SkillBox 1.
Uncertainty is not a flaw in forecasting. It is the reason forecasting exists.
If the future were known, no forecast would be necessary. The real task is not to eliminate uncertainty, but to manage it through disciplined interpretation and action.
This is why forecasting should be understood as a decision loop, not a one-time calculation.
The loop is simple:
Forecasts inform decisions → decisions change conditions → new data emerge → forecasts are updated
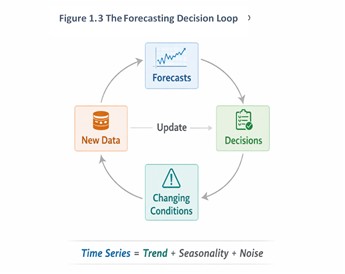
This ongoing cycle distinguishes forecasting from static prediction. Forecasting is not only about estimating what may happen. It is about helping organizations prepare, act, monitor, and revise over time.
Accuracy of empirical verification matters, but it is not enough.
A forecast can be analytically impressive and still be operationally unhelpful if it arrives too late, cannot be explained, is difficult to act upon, or fails under changing conditions. By contrast, a slightly less accurate forecast may be more valuable if it supports stable, timely, and adaptable decisions.
This is the heart of the chapter’s philosophy: forecasts should be judged not only by numerical accuracy, but by decision usefulness.
Forecasts are inputs into decisions, not substitutes for them. Their value lies in how they support learning, coordination, adaptation, and risk awareness.
This is why models don’t decide—systems do. A forecast alone does not determine action. Organizations still need rules for communication, update timing, interpretation, and managerial override.
A common mistake is treating uncertainty as leftover error that matters only after modeling. In reality, uncertainty should shape the design of the forecasting process from the beginning.
A well-designed forecasting system helps an organization remain sensible even when the future behaves differently than expected.
All of the ideas in this chapter now lead to a unifying perspective: forecasting by design.
The central argument of this chapter can now be stated clearly:
Forecasting by design treats forecasting as a structured decision process, not merely a modeling exercise.
Under this perspective, the goal is not simply to produce the most accurate number in isolation. The goal is to design how forecasts are framed, interpreted, validated, updated, and used over time.
Forecasting connects three elements:
A good forecasting system does not eliminate uncertainty. It makes uncertainty visible, manageable, and actionable.
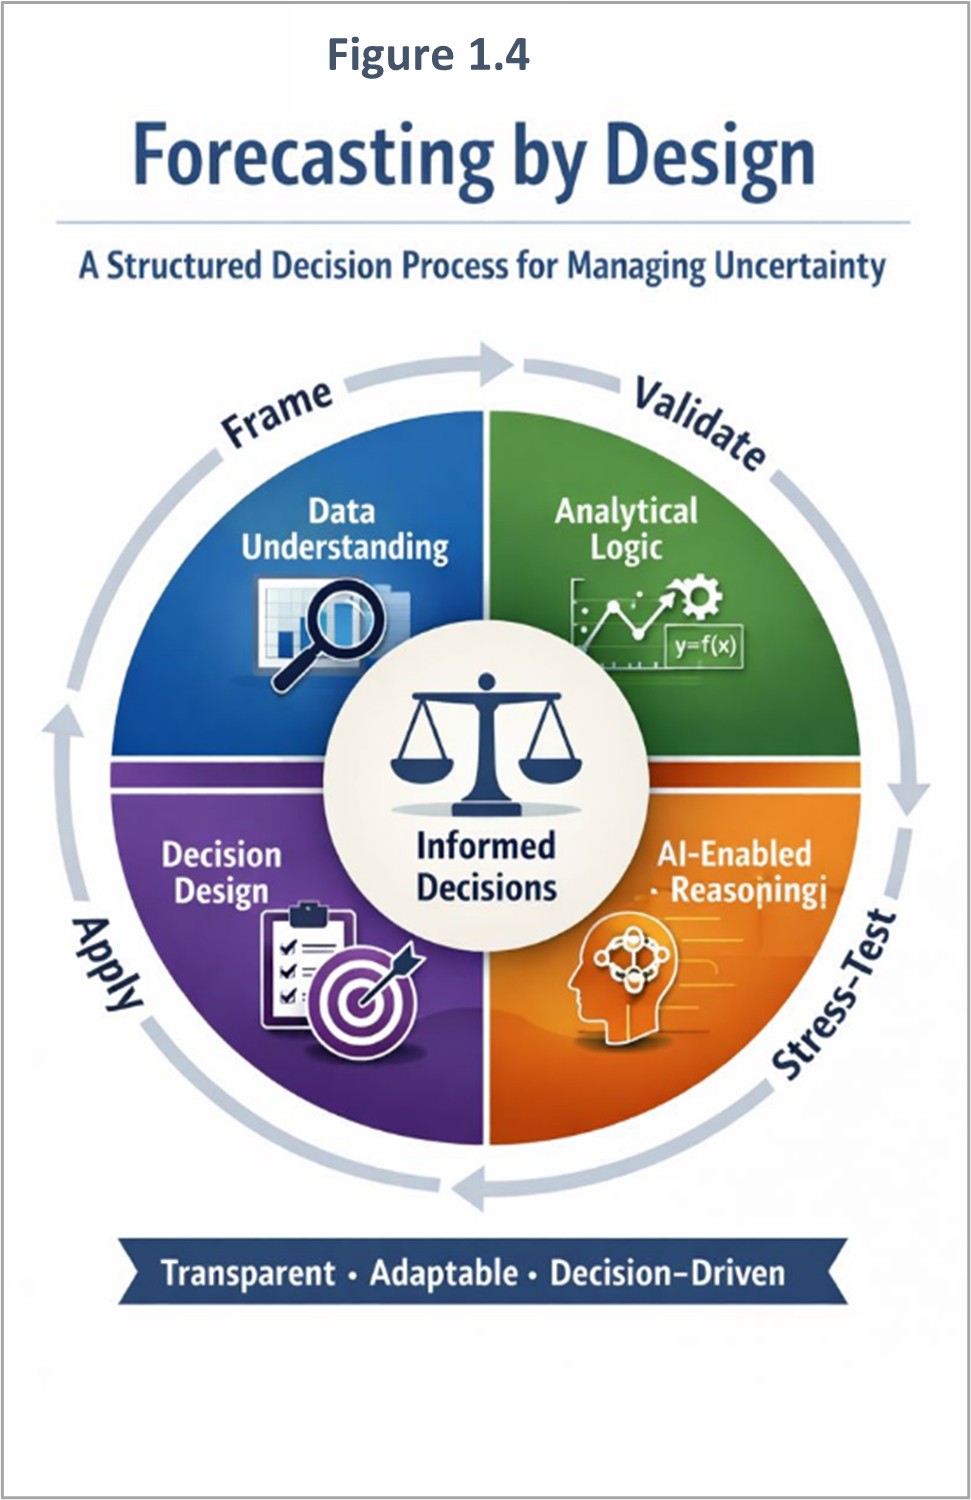
Forecasting by design integrates the four analytical pillars into one coherent logic:
No single pillar is sufficient alone. Robust forecasting emerges only when they are aligned.
Forecasting is valuable not because it guarantees certainty, but because it helps organizations reason and act responsibly in the presence of uncertainty.
The next step is not to build a complex model. It is to begin seeing how time organizes demand. We start by looking directly at NorthStar’s weekly sales series.
Visualizing Patterns in Retail Sales
To see how the ideas introduced in this chapter operate in practice, we return to NorthStar RetailGroup.
Before building forecasting models, analysts must first learn to observe how demand evolves through time. This SkillBox develops intuition about how real demand data behave by asking you to load, visualize, and interpret a simple retail time series.
At this stage, the goal is not to estimate a model. The goal is to begin learning how to distinguish signal from noise, recognize that time imposes structure on data, and understand why visual inspection is the first step in responsible forecasting.
This SkillBox primarily reinforces Data Understanding and Analytical Logic.
NorthStar RetailGroup sells everyday household products across several regions. Demand for these products is relatively stable in the long run, but weekly sales fluctuate because of promotions, recurring shopping patterns, and ordinary operational variation.
Before NorthStar’s analysts can build reliable forecasts, they must first understand what kind of variability exists in the series.
All SkillBoxes in this book use the same primary dataset family built around NorthStar RetailGroup. The datasets described in the Data Dictionary appendix and can be accessed by ctrl-clicking the dataset name in each chapter’s SkillBox or in the Data Dictionary document.
In early chapters, we use a simplified version, essentials_sales_lite.csv, containing time order and unit sales for the Everyday Essentials™ product family.
Unless otherwise noted, “sales” refers to units sold rather than revenue.
In this SkillBox, you will:
NorthStar’s inventory decisions depend on how demand is interpreted. If analysts mistake noise for meaningful change, managers may overreact and create instability. If they miss real structure, the company may respond too slowly.
The following Python and R code are provided as sample implementations, not standards, to support these tasks. You are strongly encouraged to write your own code, experiment with variations, and extend your learning beyond these examples.
import pandas as pd
import matplotlib.pyplot as plt

df = pd.read_csv("essentials_sales_lite.csv")

plt.figure(figsize=(10, 5))
plt.plot(df["week_index"], df["sales"])
plt.title("Weekly Unit Sales: Everyday Essentials™")
plt.xlabel("Week")
plt.ylabel("Units Sold")
plt.show()
R
library(ggplot2)

df <- read.csv("essentials_sales_lite.csv", stringsAsFactors = FALSE)

ggplot(df, aes(x = week_index, y = sales)) +
  geom_line() +
  labs(
    title = "Weekly Unit Sales: Everyday Essentials™",
    x = "Week",
    y = "Units Sold") +
  theme_minimal()
Your output should include:
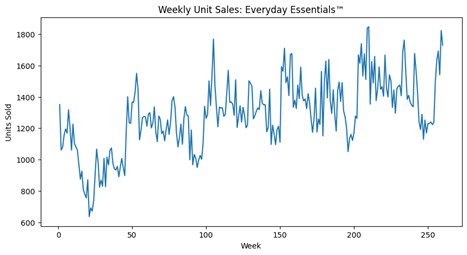
Even without formal modeling, useful insights may emerge. Some week-to-week movement may reflect normal volatility. Broader directional movement may suggest trend. Repeating shapes across intervals may hint at seasonality.
This reinforces a foundational principle of the book: forecasting methods do not create structure; they help summarize structure that may already exist.
One visible spike does not necessarily mean demand has changed structurally. Likewise, a short downward dip does not automatically indicate decline. Analysts must learn to interpret movement proportionally and cautiously.
A common mistake is treating every fluctuation as equally meaningful. In practice, many short-term changes reflect routine noise rather than meaningful shifts in underlying demand.
Visual inspection is not merely descriptive. It supports decision design by helping analysts judge how responsive or stable a later forecasting system should be.
What kind of series do you think NorthStar is facing: mostly stable, gradually shifting, strongly seasonal, or unusually noisy? What would that imply for inventory planning?
Visual observation raises a new question: which apparent patterns are meaningful, and which may be misleading? LearningLab 1 uses AI as a reasoning partner to explore that question.
Using AI as a Learning and Thinking Partner
This LearningLab reinforces the foundational ideas of Chapter 1 by using AI as both a learning partner and a thinking partner—not as a modeling shortcut.
The objective is to:
This LearningLab reinforces:
At this stage of the book, AI is not used to build forecasts. It is used to clarify thinking about what you see and what you do not yet know.
In the preceding SkillBox, you visualized NorthStar’s weekly sales and began identifying possible patterns. Some movements may appear meaningful. Others may simply reflect routine variation.
The challenge is that early patterns are easy to see—but difficult to interpret correctly.
This LearningLab introduces the next step: using AI to expand your interpretation while maintaining analytical discipline.
At this stage, your goal is not to reach the “correct” answer. Your goal is to:
AI is used here to:
Important principle:
AI responses should be treated as hypotheses to evaluate, not conclusions to accept.
NorthStar analysts have completed their first visual inspection of weekly sales. The series shows variation over time, including occasional spikes and dips.
At first glance, some patterns may seem clear. But closer inspection raises important uncertainties:
At this early stage, misinterpretation is more dangerous than lack of precision.
To reduce that risk, analysts use AI not to generate answers, but to expand and challenge their reasoning before forming conclusions.
You will engage with AI in three structured modes:
Reinforce → Extend → Explore
Work through them in order. Each mode builds a different layer of understanding and expansion.
Confirm and stabilize your understanding of the chapter’s core ideas.
At this stage, you are not analyzing the dataset further—you are strengthening the conceptual lens through which you interpret it.
Start your prompt by providing key concepts from the chapter as shown below, then follow with one of the listed prompts or your own chapter-related prompts. This ensures that AI responses align with and reinforce the chapter’s coverage.
Repeating the quiz prompt will generate additional quiz questions.
“ Key concepts from chapter 1.
“I understand the key ideas and can explain them clearly in my own words.”
Challenge your initial interpretation of the data, recognize uncertainty.
Optionally explore additional analytical concepts or methods that interest you but not covered in the chapter.
This is where you begin to see that what looks obvious may not be reliable, and to question what may be relevant but not explicitly discussed in the chapter.
“I recognize that early interpretations are uncertain and require disciplined reasoning.”
“I search for some additional analytical topics.”
Connect interpretation to decisions. You are learning how analytics shapes thinking about action and how forecasting connects with other disciplines.
“I understand that interpretation—not just accuracy—affects decisions.”
After completing all three modes:
The goal is to evaluate reasoning—not outsource it.
Prepare a short written summary (200–300 words) describing:
You must:
Principle:
AI expands analytical range, but responsibility remains human.
AI can:
But it cannot:
Insight:
At the beginning of forecasting, the most important skill is not prediction—it is disciplined interpretation of time.
You have now moved from:
seeing → interpreting
The next step is:
interpreting → framing decisions
How should early observations and uncertain interpretations begin to shape:
The DesignStudio will move from:
understanding → reasoning → decision framing
NorthStar RetailGroup: Inventory Planning Under Uncertainty
This DesignStudio introduces the core thesis of the book: forecasting creates value when it improves decisions under uncertainty.
You now move from observing data and interpreting patterns to designing how forecasting should support a real operational decision.
This DesignStudio primarily reinforces Decision Design.
NorthStar operates multiple stores supplied by regional distribution centers. At the start of each quarter, managers must decide how much inventory to commit for the coming weeks.
They face two competing risks:
Forecasts are available, but leadership understands that a forecast alone does not determine the right action.
How should NorthStar design a forecast-informed process for inventory planning when demand is uncertain and short-term variation may be misleading?
NorthStar currently has access to:
Address the following prompts:
Prepare a one-page memo or diagram describing:
Your work will be evaluated on:
A forecast-informed decision system is stronger than a forecast alone because it clarifies what information matters, how uncertainty is interpreted, and where human responsibility remains.
What would be more dangerous for NorthStar: a system that reacts too quickly or one that reacts too slowly? Under what conditions might your answer change?
NorthStar shows how forecasting supports retail operations. The next mini-case transfers the same logic to a public-sector setting.
Using Forecasts to Support Public Decisions
A regional government relies on revenue forecasts to plan public services, infrastructure investments, and staffing. Recent economic disruptions have made revenue streams more volatile, increasing uncertainty about future conditions. Budget decisions still must be made months in advance.
How should policymakers use revenue forecasts responsibly when future tax and fee collections are uncertain?
Policymakers have access to:
Using Chapter 1 concepts:
Write a short response explaining how forecasts should guide budget planning without creating false confidence.
What risks arise when policymakers rely too heavily on a single point forecast? How can forecasts be used responsibly even when uncertainty remains high?
This mini-case reinforces the chapter’s central lesson: forecasts do not eliminate uncertainty. They help decision-makers act more responsibly within it.
These questions consolidate the conceptual foundations of the chapter. Explain your reasoning clearly, distinguish signal from noise, connect analysis to decisions, and avoid purely technical answers.
Three ideas matter most in this chapter. First, forecasting exists because decisions must be made before outcomes are known. Second, forecasting differs from general prediction because it is explicitly organized through time and tied to action. Third, effective forecasting depends on more than models; it depends on how data, reasoning, AI, and decision processes are designed to work together.
One decision insight stands out: models don’t decide—systems do. A forecast becomes valuable only when it helps people interpret uncertainty and act responsibly.
One common mistake is to treat every movement in time-series data as equally meaningful. Good forecasting begins by learning to see structure without overreacting to noise.
In this chapter, you learned that seeing structure in time is the starting point of forecasting. But recognizing that noise exists is not the same as knowing how to manage it. If short-term fluctuations can obscure the direction of demand, how can analysts reveal a clearer signal without reacting to every temporary swing?
That unresolved problem leads directly to Chapter 2, where smoothing methods help transform noisy observations into more interpretable signals.

