Imagine you’re a policymaker deciding how much to increase Social Security payments, a business leader planning next year’s pricing strategy, or a researcher studying poverty. In all these cases, you need to know how much one dollar can buy at different times. You will likely rely on official measures of inflation like the Consumer Price Index (CPI). But what if the CPI measures are missing something important, especially in our globalized world where international trade shapes what we buy and how much we pay?
In our new paper “Assessing the Aggregate Price Effects of Trade using the Food Engel Curve,” we tackle this question head-on. We build price indexes directly from trade theory and data. We then compare these Open-Economy Price Indexes, or OPIs, to CPI. Do our theory-based price indexes line up with observed household consumption better than the official CPI does? To answer this question, we use one of the oldest and most reliable data regularities in economics.
That regularity is Engel's law. Named after the nineteenth-century statistician Ernst Engel, it describes how as households grow richer, they spend a smaller share of income on food. Food is a necessity, so once basic needs are met, additional income flows toward other things. This relationship, the food Engel curve, has held up remarkably well across countries and across time.
A household’s position of the Engel curve depends on its purchasing power or real income, that is, nominal income deflated by a price index. If prices are measured correctly, the relationship between food's budget share and real income should stay put from year to year. If the index is biased, the curve will drift even though behavior has not changed. Those systematic shifts are the fingerprint of mismeasurement. By measuring how much the Engel curve wanders over time, we back out the bias of a price index.
Our OPI combines disaggregated data on the unit values and quantities of imported products with expenditure-share adjustments for imports. Together, these inputs produce an aggregate price index covering both imported and domestic goods. Rather than sampling a fixed basket the way the CPI does, we reconstruct the price of consumption from the ground up using what the country actually imports and produces. This granularity accounts for two things the CPI is known to miss.
The first is new goods. Consumers benefit not only when existing products get cheaper but also when international trade opens access to a wider variety of goods. If part of a price increase pays for more varieties, the CPI may overstate inflation. The second is quality: as products improve, part of a price increase simply pays for better goods and should not count as inflation, either. OPI is based on theory that addresses both of these concerns.
According to the Engel curve test, in our sample OPI better tracks household behavior than CPI. Summarized by root mean squared bias, the typical mismeasurement amount, CPI scores 0.070, while OPI goes down to 0.030, less than half the bias of CPI. Another way to see the improvement is to look at the year-to-year deviations directly. Under CPI, mismeasurement is statistically different from zero in 7 of the 11 years studied. Under OPI, it is only statistically different in a single year.
Our results indicate that CPI climbs steadily from the 1990s to about 1.57 by 2015, while the OPI lines sit consistently below it. In fact, the OPI falls in the late 1990s and early 2000s, suggesting that once the gains from expanding global trade are properly accounted for, the purchasing power of a dollar in the United States actually increased in that period. The OPI then began to rise since the mid 2000s but remained below the level of CPI.
Overall, we find that the OPI better accords with regularities in households’ consumption behavior, correcting for a substantial portion of the CPI’s upward bias in measuring the true rate of inflation.
Where do these gains come from? Decomposing OPI, we find that the arrival of new varieties, does much of the work. Without those new varieties the bias more than doubles, jumping to 0.072, right back in CPI territory. A large part of what looks like CPI bias is really mismeasured gains from trade.
Price indexes are essential for how we measure inflation, real wages, growth, and the cost of living. They shape decisions from monetary policy to the indexing of benefits. For example, if the official measure of CPI miscalculates the cost of living, it can lead to overly generous or unnecessarily stingy adjustments to wages, benefits, and tax brackets. If the gains from trade are not properly taken into account, then the true improvement in living standards was larger than the CPI numbers suggest. By combining trade data, economic theory, and household behavior, we offer a blueprint for more accurate and meaningful price measurement.

When the U.S. raises a tariff on an imported good, who absorbs the cost? Leading studies of the 2018 Trump-era tariffs concluded that the new duties were “completely passed through” to U.S. import prices — meaning a 10% tariff raised prices by 10%, with the full burden falling on importers rather than foreign exporters.
Purdue economist Anson Soderbery challenges that tidy conclusion in a new working paper, “Just Passing Through? An Empirical Analysis of Import Price Responses to Tariff Shocks.” Re-examining U.S. import and tariff data on Chinese goods from 2016 to 2019, Soderbery and fellow Purdue economist Justin L. Tobias find that passthrough is far from uniform — and that treating it as a single number can badly distort the economic case for or against a tariff.
The researchers begin by reproducing the familiar result: pooled across all products, tariff passthrough looks essentially complete. But that average conceals wide variation. Estimating a separate passthrough rate for each of more than 15,000 products individually displays substantial heterogeneity across products but proves too noisy to be useful. Soderbery and Tobias build a new statistical model — a Bayesian approach that aims to sort each good into one of three categories: incomplete passthrough (the exporter absorbs part of the tariff), complete passthrough (the importer pays it all), or more-than-complete passthrough (prices rise by even more than the tariff). Rather than imposing a common response for every good, the model lets the data assign each good a probability of belonging to each passthrough category and then estimates a product specific passthrough rate.
The results reveal a clear and economically meaningful pattern. Roughly 62% of products fit the complete-passthrough regime, but the rest split in revealing ways. Agricultural goods overwhelmingly showed incomplete passthrough. Industrial input and capital goods, by contrast, showed the highest passthrough, frequently exceeding 100%.
That “more-than-complete” outcome (where prices rise more than the tariff!) is hard to square with textbook theory, so the authors dug into why it happens. One culprit stands out: Chinese government subsidies. Goods that triggered U.S. countervailing-duty investigations—a signal that Beijing was subsidizing the exporter — were about 30% more likely to land in the more-than-complete regime and showed passthrough rates roughly a third higher on average. The implication is that subsidies acted as a buffer, effectively shifting even more of the tariff burden onto U.S. buyers and hinting at a deliberate retaliatory response to the Trump tariffs.
This is more than a statistical refinement. When Soderbery and Tobias translate their estimates into welfare effects — the estimated net gain or loss to the U.S. economy — results can change when departing from the assumption of a common passthrough rate across all goods. Assuming that passthrough is universal and complete delivers an estimated welfare loss to the U.S. on the order of $4 billion a month by late 2019. Allowing for heterogenous passthrough produces a similar total effect but also highlights significant variance in welfare effects both across and within goods. Duties applied only to input products, for example, would exacerbate the welfare loss while those applied only to agricultural products may generate gains for the U.S. The standard complete-passthrough assumption misses this distinction entirely.
As a new round of tariff increases took center stage in 2025, the question of who bears their cost continues to be at the forefront of trade policy analysis. Soderbery and Tobias’s work offers a cautionary message for that debate: the burden of a tariff is not a fixed law of economics but a product-by-product outcome shaped by market power, supply chains, and the strategic responses of trading partners. Evaluating trade policy while imposing a common tariff passthrough response — however convenient — risks getting both the magnitude and the direction of its effects wrong.
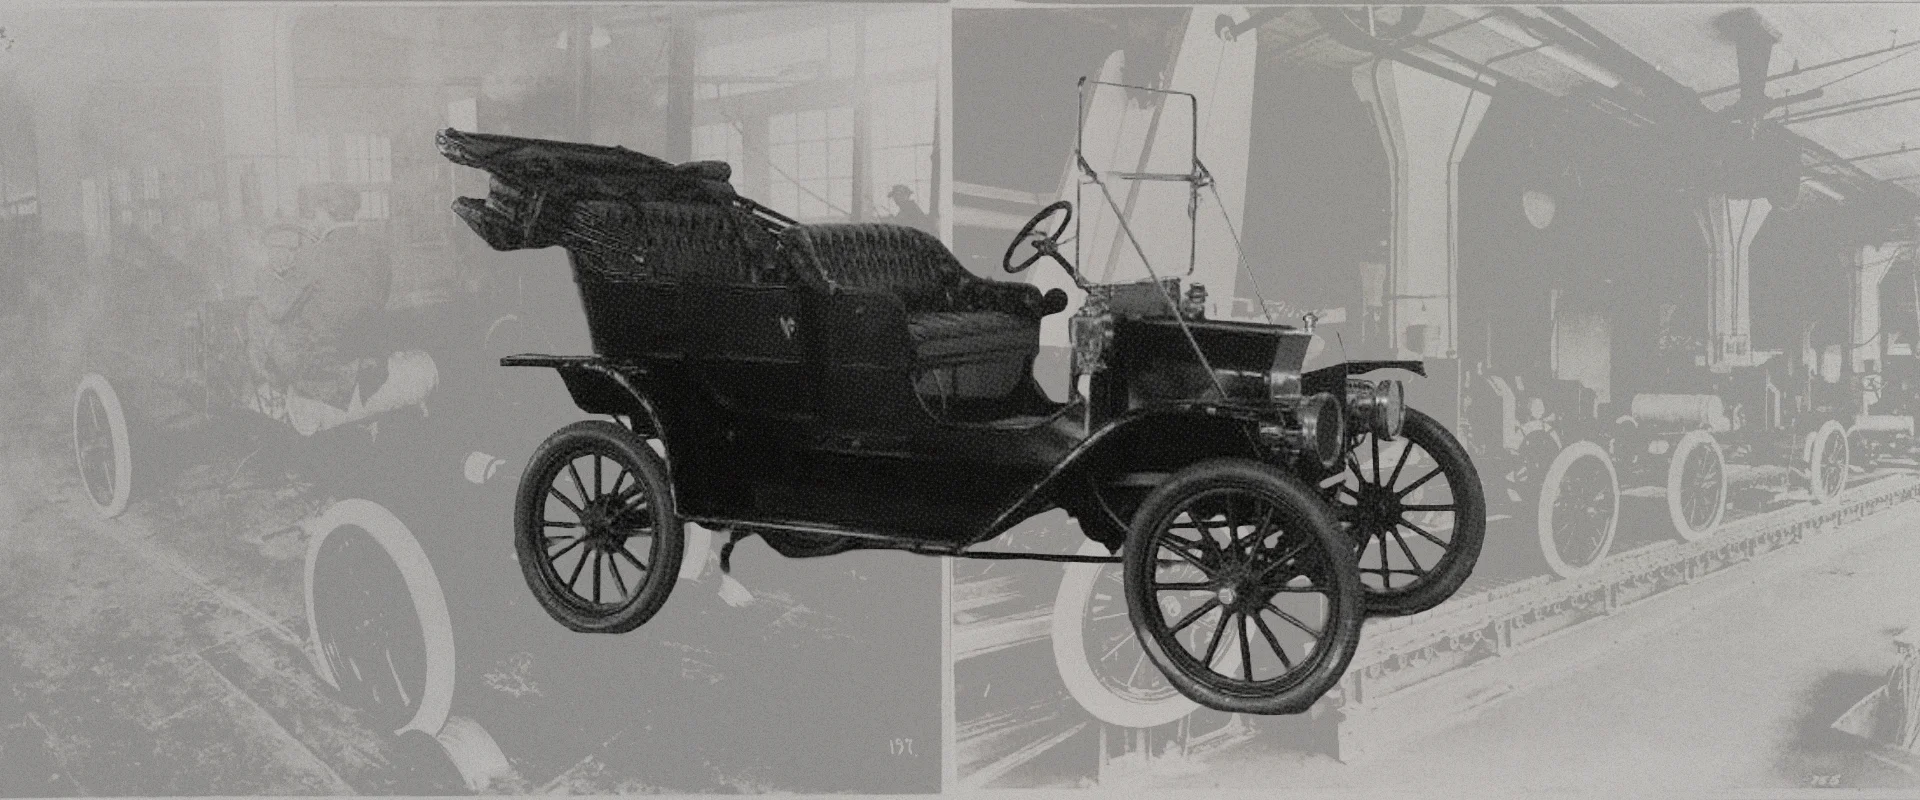
Examining Barriers to Adopting New Technologies: An Example from the Early 20th Century
2025