The field of sports analytics exploded following the release of the 2011 film Moneyball, which follows Oakland Athletics manager Billy Beane’s use of analytics to build a winning baseball team on a shoestring budget.
Today, sports analytics falls into one of two categories: on-field analytics and off-field analytics. On-field analytics deals with improving team and individual performance, adjusting in-game strategies, making coaching changes and the like. Off-field analytics addresses the business side of sports by helping an organization find patterns and insights through data that help increase ticket and merchandise sales, improve fan engagement, and make decisions leading to higher growth and increased profitability.
The latter category was the focus of a group of students in the Daniels School’s undergraduate Business Analytics and Information Management (BAIM) Association through a partnership with the John Purdue Club (JPC), whose members fund the entire $13.5 million cost of attending Purdue for student-athletes along with other academic costs impacting student-athlete development initiatives. Members also enjoy exclusive benefits such as priority access to tickets and parking.

The effort was primarily led by Collin Glover, vice president of corporate partnerships for the BAIM Association, with assistance from President Melissa Dudley and former VP of Marketing and Operations Joel Vittori. “Special thanks go out to alum Don MacKay for helping us procure the project and giving us guidance,” Glover says. “We’re also grateful to our faculty advisor Zhiwei Zhu and alumni advisor Brandy Ake for giving us feedback throughout the course of the initiative.”
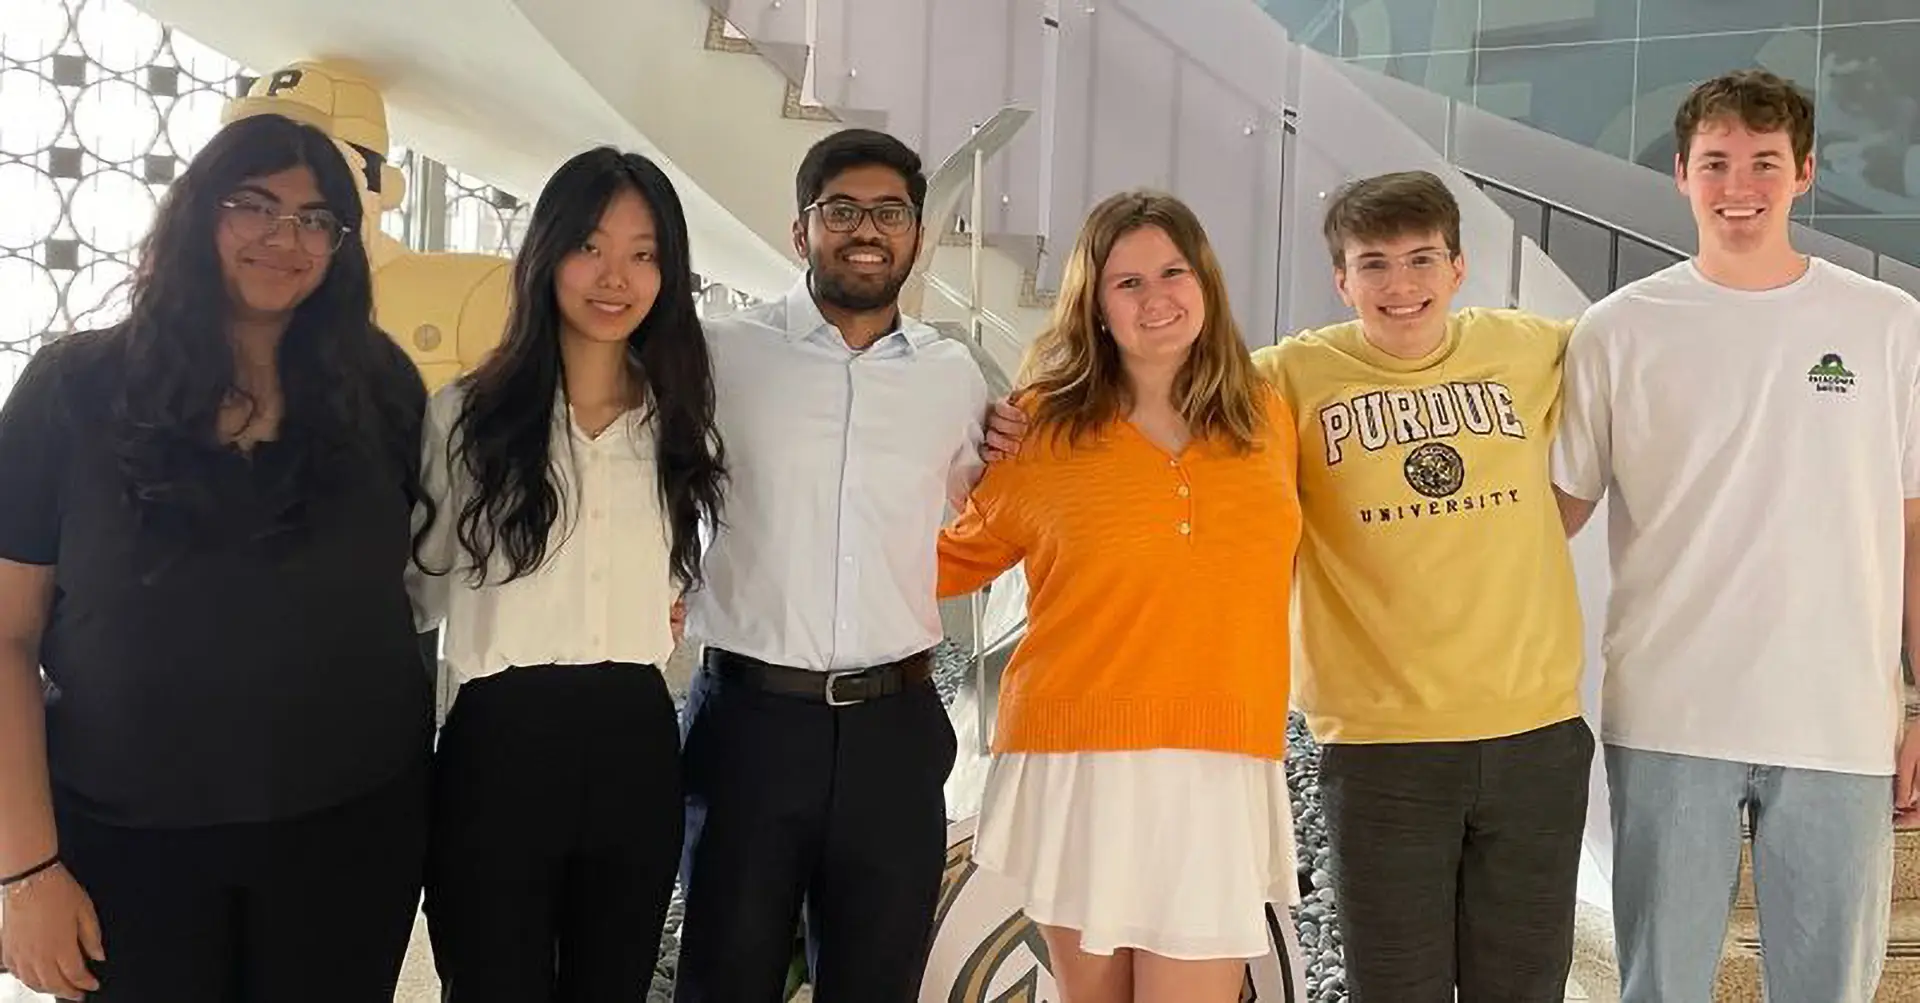
The project team was comprised of BAIM students Umar Yasser, Aashna Chandnani and Luna Zhou, who were tasked with analyzing a catalog of season ticket holders who do not currently contribute to JPC. The analysis aimed to identify high-income areas and potential individuals to approach for donations. The project included a review of non-renewal membership data, incorporating external sources to enhance data validity and reliability, leading to insightful findings on potential new JPC fundraisers and strategic recommendations for targeted outreach.
“Collaborating with our peers required us to reconcile conflicting ideas and integrate new concepts into a cohesive strategy. Working as a team, we had to make collective decisions, ensuring that each member’s input was valued and considered.” — Aashna Chandnani
“We used Power BI for organizing tables, merging data from various sources and creating income buckets for our final presentation,” Chandnani says. “The U.S. Census Bureau also provided external data on income to enhance our analysis. Excel was our primary platform for data manipulation and initial analysis, enabling us to manage and preprocess the data efficiently, while Power BI was instrumental in transforming the raw data into meaningful insights, allowing us to effectively present our findings.”
The team’s recommendations to the John Purdue Club were focused on strategic targeting to maximize membership renewals and donations. “We advised JPC to concentrate on areas around Purdue University, specifically targeting high-potential regions in Indiana and Chicago,” Zhou says. “Within these areas, we identified cities with the highest likelihood of members renewing their memberships and contributing more significantly, considering factors such as ‘Purdue Families’ as well as interest in sports.”
The project, which is continuing this fall, is already helping the students leverage their academic experience. “The most obvious impact is that I actually get to use the knowledge I learned in class to solve real problems,” Zhou says. “More importantly, I get to talk to people and work as a group to make the best decisions. We didn’t always agree, but each of us is able to take different opinions and listen to what others say in this process and at the same time express our own thoughts.”
“The project was a great opportunity to gain experience in the practical applications of the skills that we are studying in our classes and are needed in the industry. It enabled us to gain familiarity with tools that we will be using in the future.” — Umar Yasser
“This project significantly enriched my academic experience by providing practical applications of the theoretical knowledge gained in my coursework,” Chandnani adds. “Collaborating with our peers required us to reconcile conflicting ideas and integrate new concepts into a cohesive strategy. Working as a team, we had to make collective decisions, ensuring that each member’s input was valued and considered.”
Yasser wholeheartedly agrees with his teammates. “The project was a great opportunity to gain experience in the practical applications of the skills that we are studying in our classes and are needed in the industry,” he says. “It enabled us to gain familiarity with Excel and Power BI, tools that we will be using in the future. It also taught us the importance and need to value everyone's opinion and to tap into the experience of our seniors and mentors.”
For information on partnering with the BAIM Association on analytics projects, contact Collin Glover at glover40@purdue.edu or email bsbaim@purdue.edu.
Teams of students from eight Indiana colleges and universities competed last spring to provide winning retail solutions for the NCAA through the annual Crossroads Classic Analytics Challenge. The 2024 case challenge asked teams to leverage data provided by the NCAA to help understand customer purchasing behavior for the Division I Women’s Basketball Tournament.

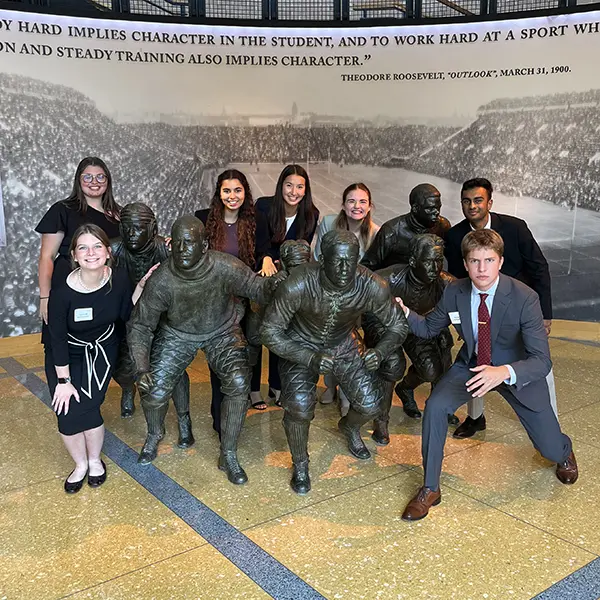
Competing teams were required to pass through several rounds that included building machine learning models, Tableau dashboards, presentations and video submissions. It kicked off at the NCAA Hall of Champions in Indianapolis, where participants engaged with stakeholders to learn more about the case problem and expectations. During the month-long preparation process, students received training and support from experts at Tableau and attended a Sports Analytics Townhall to learn more about analytics in sports.
A team of students from the Daniels School’s MS in Business Analytics and Information Management (MSBAIM) program won 2nd place in the graduate division, as well as the award for Best Data Visualization. The team was comprised of Soham Agarwal, Durgamadhab Dash, Vishnu Vardhan Ponduri, Sohan Kumar Sahoo and Nagarjuna Chidarala.
To make their solution stand out, the team focused on what was needed to progress through each round of the competition. “We made sure to employ cross-validation processes and look at the solutions from different approaches, ensuring we had taken the most important factors into consideration,” Agarwal says. “Along with building a video presentation, we were able to create appealing visuals that stood out in our dashboards and PowerPoint decks. This helped us convey the insights and information we intended.”
Agarwal says the experience will make them stand out to prospective employers. “I think we were able articulate a story out of this for our resumes and as a test of our individual capabilities in a competitive environment,” he says. “It’s also evident that our learning transcended the boundaries of mere data analysis. We realized the importance of communication and team synergy, which was critical in our ability to derive meaningful insights.”